Biochemical Modelling
Motivation
In order to create a flow with bacteria using their flagella movement as the motor, it is important to understand bacterial motility and the effects our genetic manipulation have on it.
Bacterial motion resembles a random walk, with periods of smooth swimming interrupted by brief tumbles that change the swimming direction. Chemotaxis is achieved by modulation of the tumbling frequency.
In our case, we have added phototaxis to E. coli MG1655 cells making them react to light as well as chemical gradients.
By creating a model describing the key features of the system, it will be possible to study the biochemical behaviour of such a system, and how different parameters will affect it, before it is implemented in a bacterial strain.
The real system
Several chemosensory systems exist in bacteria. The one most studied is the chemotaxis of E. coli. Polar clusters of membrane-spanning methyl accepting chemotaxis proteins (MCPs) are positioned in the ends of the rod shaped E. coli [1].
Tar (responding to aspartate), Tsr (responding to serine), Tap (responding todipetides), Trg (responding to galactose) ang Aer (responding to oxygen) are the most common of these receptors seen in E. coli strains[2]. Transduction of the signal between the MCPs and the flagella motor is managed by a particular fine-tuned signalling cascade, which is governed by several intracellular proteins.
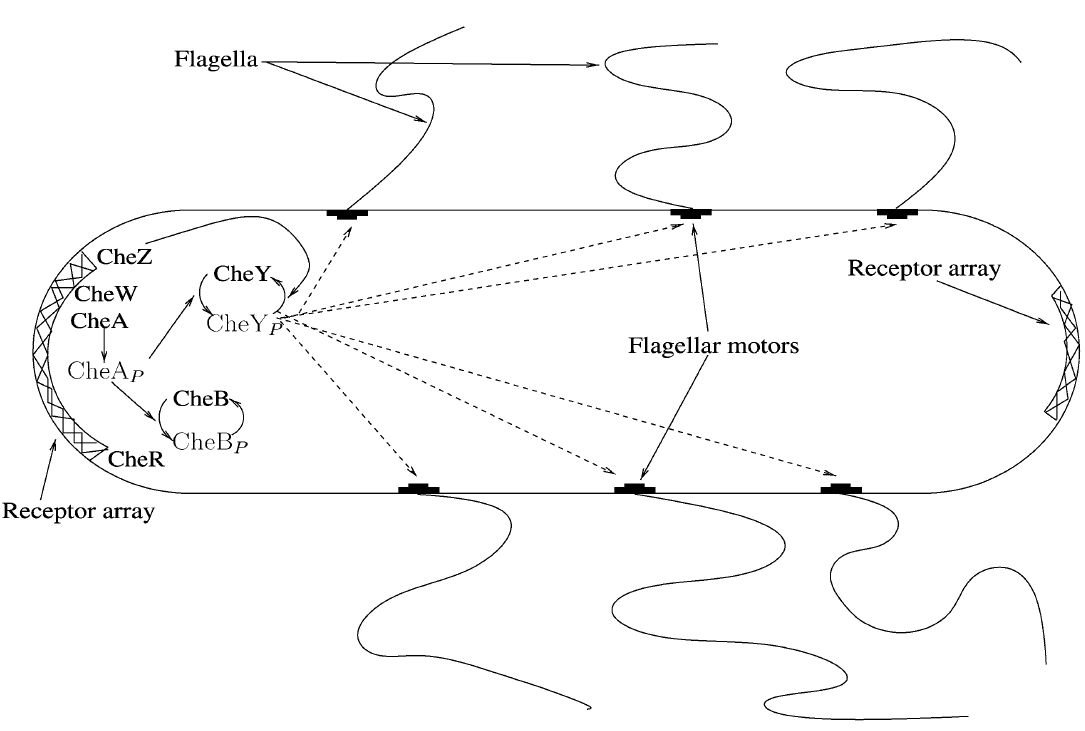
Figure 1: Schematics of the bacterial chemotaxis pathways [
2]
Chemotaxis consists of three important phases: reaction, adaptation and relaxation. In the reaction phase, one of the MCPs sense the specific chemical gradient it responds to and the membrane protein activates the CheW enzyme. The active CheW enzyme suppresses the auto-phosphorylation of the CheA enzyme and when no or very little CheA enzyme is phosphorylated, no phosphorylation of the CheY and CheB enzymes occurs. In the end, this increases run, because phosphorylated CheY binds to the flagella motors and induce tumbling. When the bacteria have reached the area with a higher concentration of the chemical in question adaptation sets in.
Because no CheB have been phosphorylated during the reaction period CheR is “allowed” to methylate the MCPs, which increases the auto-phosphorylation of the CheA enzyme. This increase in auto-phosphorylation of CheA results in phosphorylation of CheY that leads to tumbling of the bacteria. In the last phase, relaxation, CheB has again been phosphorylated by CheA and is now able to demethylate the MCPs, returning the bacteria to its normal run/tumble frequency with a 0,1 second tumbling period every 1 second.
One other thing to consider in the model is the distance from the CheY phosphorylation site to the flagella motors that are randomly located on the entire cell body [1]. Several modelling methods have been proposed and nearly all of them include these considerations [1]:
"Attractant is assumed to be in excess and binding is assumed to be rapid". One of the most common receptor types to be modelled is the Tar receptor. This is not unexpected given that a large degree of the experimental literature has focused on the response of E. coli to aspartate which is detected by this receptor. Tar is also one of the most abundant receptors within the cytoplasmic membrane.
In models which have focused on the adaptation and/or the phosphorylation cascade, receptors are commonly modelled as complexes consisting of MCP, CheW and CheA. This is justified by the tight association of CheW and CheA to the MCP receptors.
Descriptions of the motor bias, given the limited detail available on the interactions of both CheY-p and CheY with the cytoplasmic FliM end of flagella motors and that this interaction may be quite complex, it has been a common, simplifying assumption of a number of authors that the fraction of time a motor spends spinning counter-clockwise can be expressed in terms of CheY-p by a Hill function. Such reactions are based on experimental observations.
Description of the model
The model we will be using to predict biochemical behaviour of the system is a simplification of the real system.
The simplified model does not consider the normal metabolism in the cell. It only includes the most important enzymes in the normal E. coli chemotaxis pathway and the proteins responsible for coupling phototaxis to chemotaxis.
Below, you will find a schematic representation of the system our biochemical modelling was performed on. The crossed-over enzymes and proteins have not been modelled as a differential equation but considered as constants in the system.
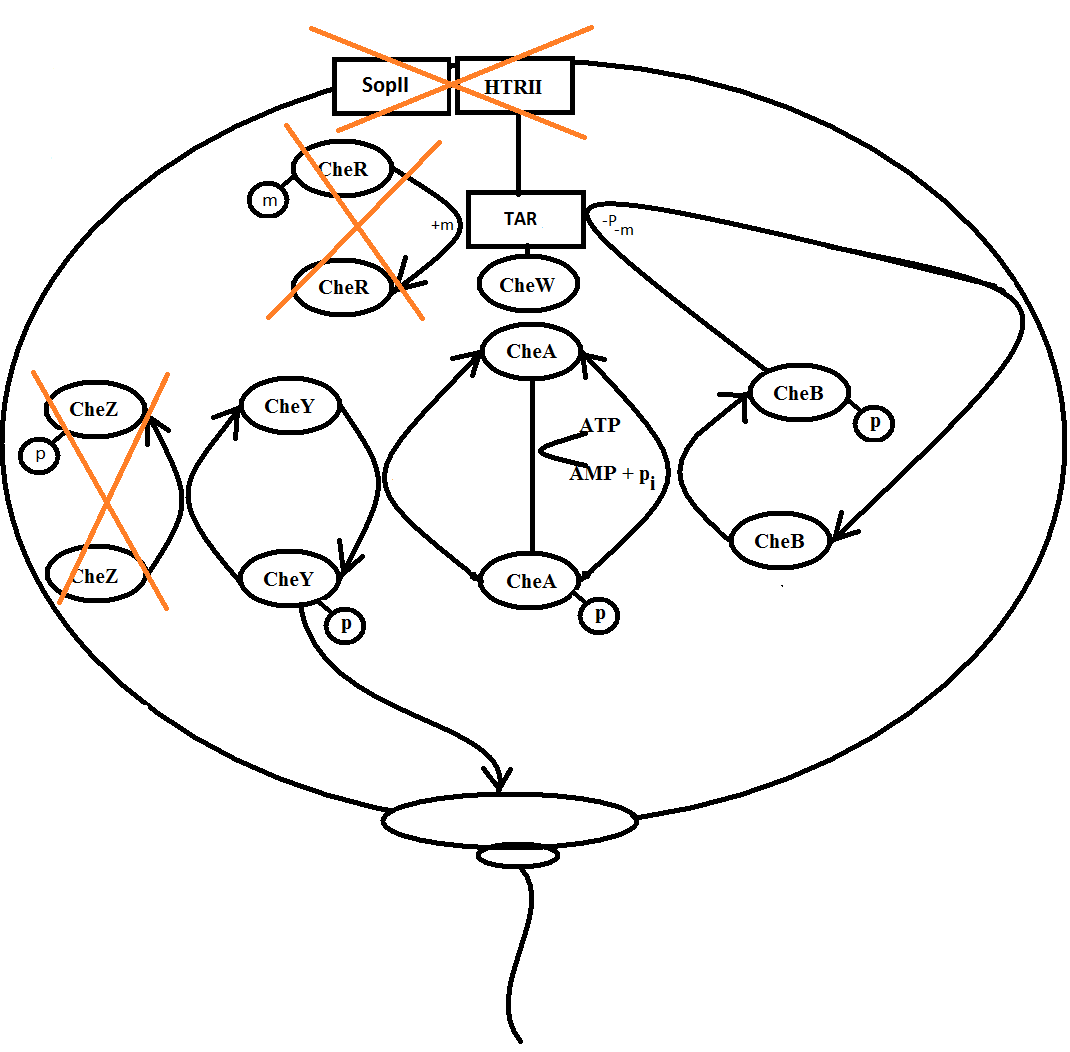
Figure 2: Schematics of the system we want to make. The enzymes that are crossed-over are considered constant in our system.
The important enzymes in the system are mathematically represented by a differential equation under the assumption of steady state in the system and modelled in a demo version of the program [http://www.berkeleymadonna.com/ Berkeley Madonna].
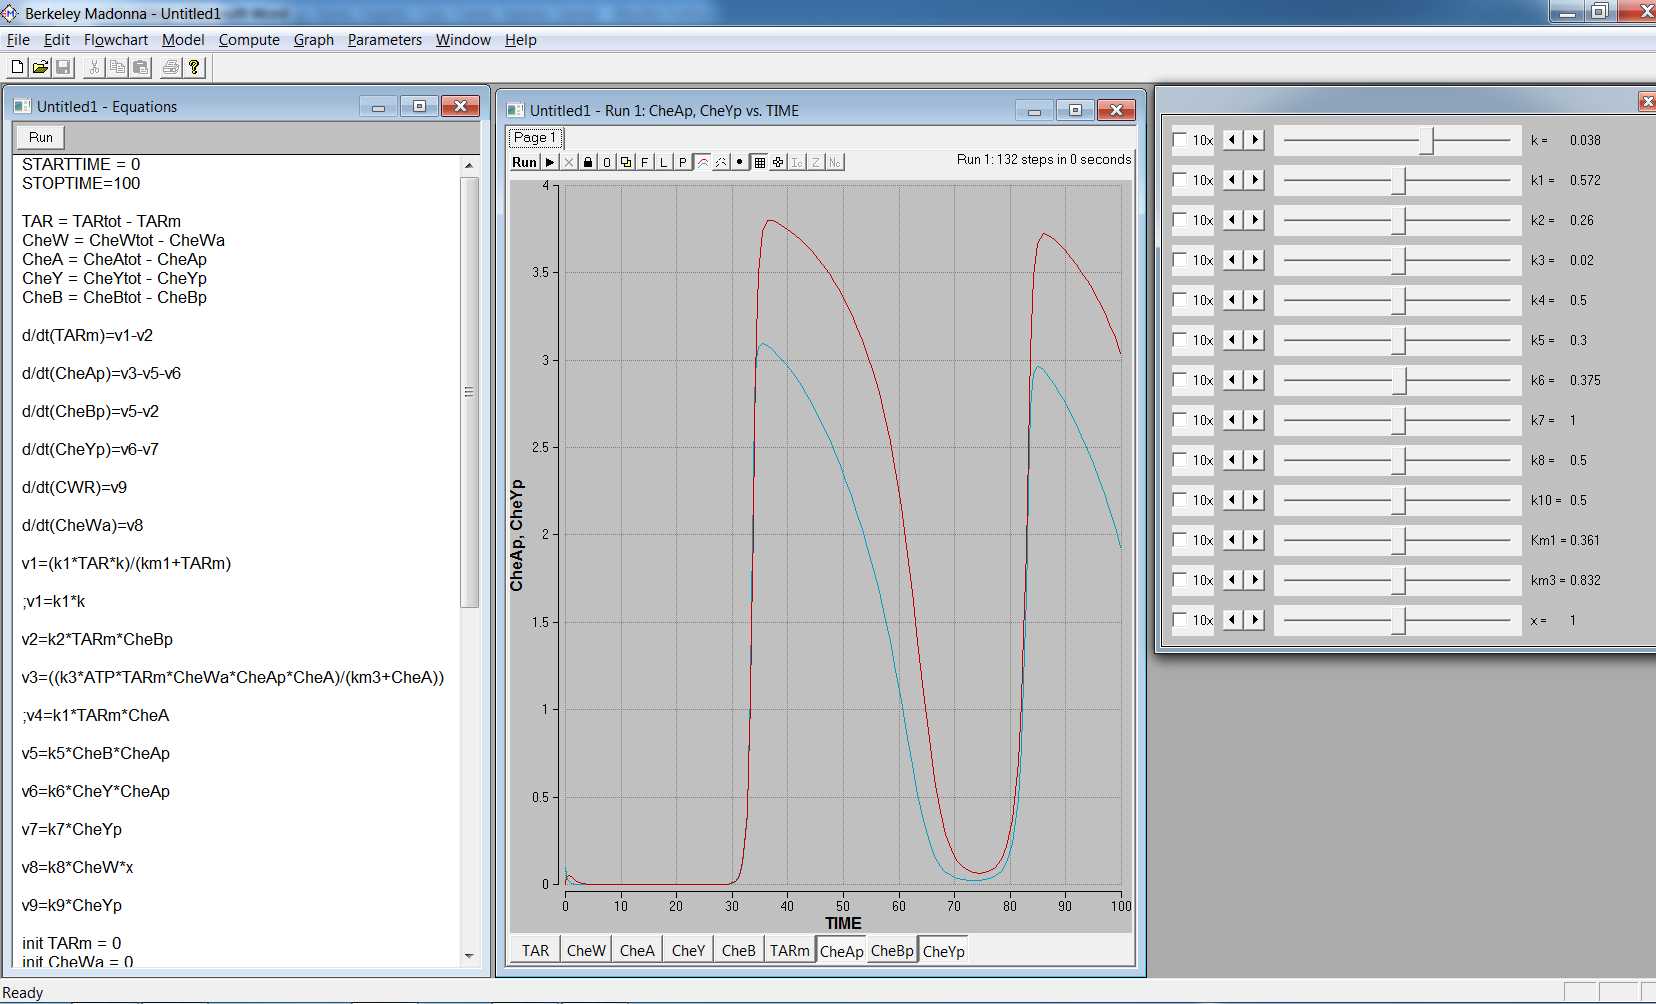
Figure 3: Picture from the modelling program Berkeley Madonna, showing a model example.
When light hits the photo receptor SopII, the signal is transduced through the HtrII and Tar and onto the enzyme CheW. CheW is then activated because it is a straight-forward signal transduction. The proteins SopII and HtrII are not considered in the model and the equation for the activation of CheW is:
When the CheW enzyme is activated, it induces auto-phosphorylation of CheA. The phosphorylated CheA can then phosphorylate the enzymes CheY and CheB. The equation for CheA-p concentration is given by:
Phosphorylated CheY is produced by phosphorylation of CheA and is removed by CheZ which, in this model, is defined by a constant k. This can be described mathematically by this equation:
Phosphorylated CheB is dephosphorylated when methylated Tar is demethylated, this can be described mathematically by this equation:
Methylated Tar is constantly produced by the CheR enzyme which, in this model, is also considered a constant. The demethylation is performed by CheB-p. The concentration of methylated Tar can be described by this equation:
In Berkeley Madonna it is possible to define different parameters as sliders which enable the user to change parameters continually while the model is running. The sliders used in the model are:
Model results
With the Madonna program it is possible to model the system parameters, the most important of them are:
TAR/TARm
CheA/CheAp
CheB/CheBp
CheY/CheYp
Flagella moters CCW/CW
The time scale of the model might be to large, because it’s not possible to define units to the different parameters in the model such as defining time steps as seconds, minutes and so on, the problem involves defining concentrations of the enzymes.
Some of the initial reaction rate constants and enzyme concentrations was from articles, and afterwards optimized for this model [3].
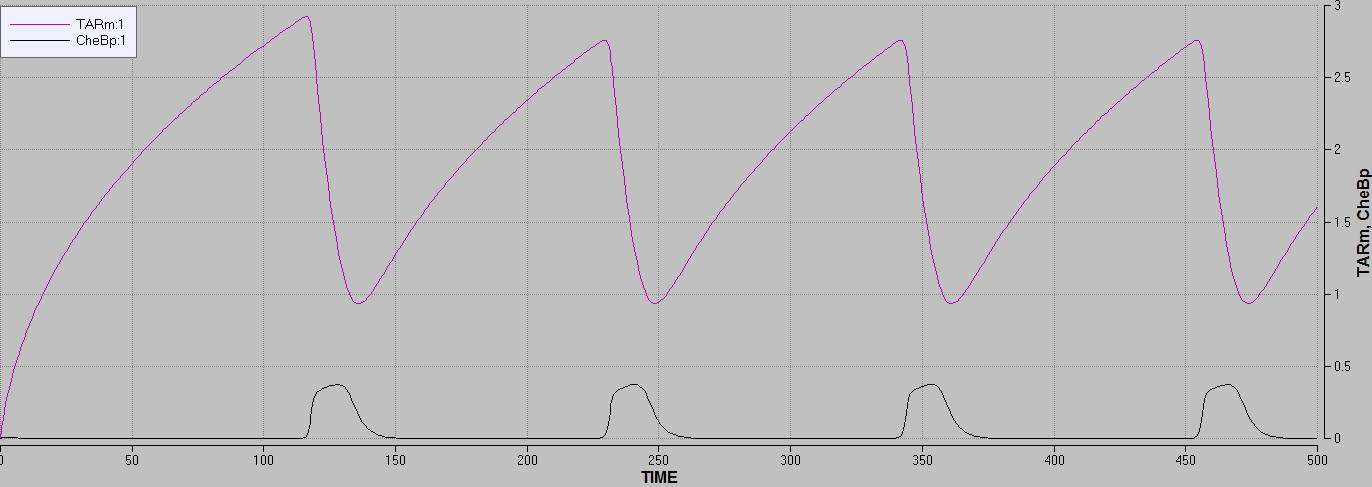
Figure 4: graph showing the concentration of phosphorylated CheB affecting the concentration of methylated TAR, making them drop.
Focusing on the behaviour of TAR/TARm in the model (Figure 4), it demonstrates that the concentration of methylated TAR rises if no phosphorylated CheB is present in the system.
When the concentration of phosphorylated CheB rises the concentration of methylated TAR drops.
This corresponded well with the known theory for the real system.
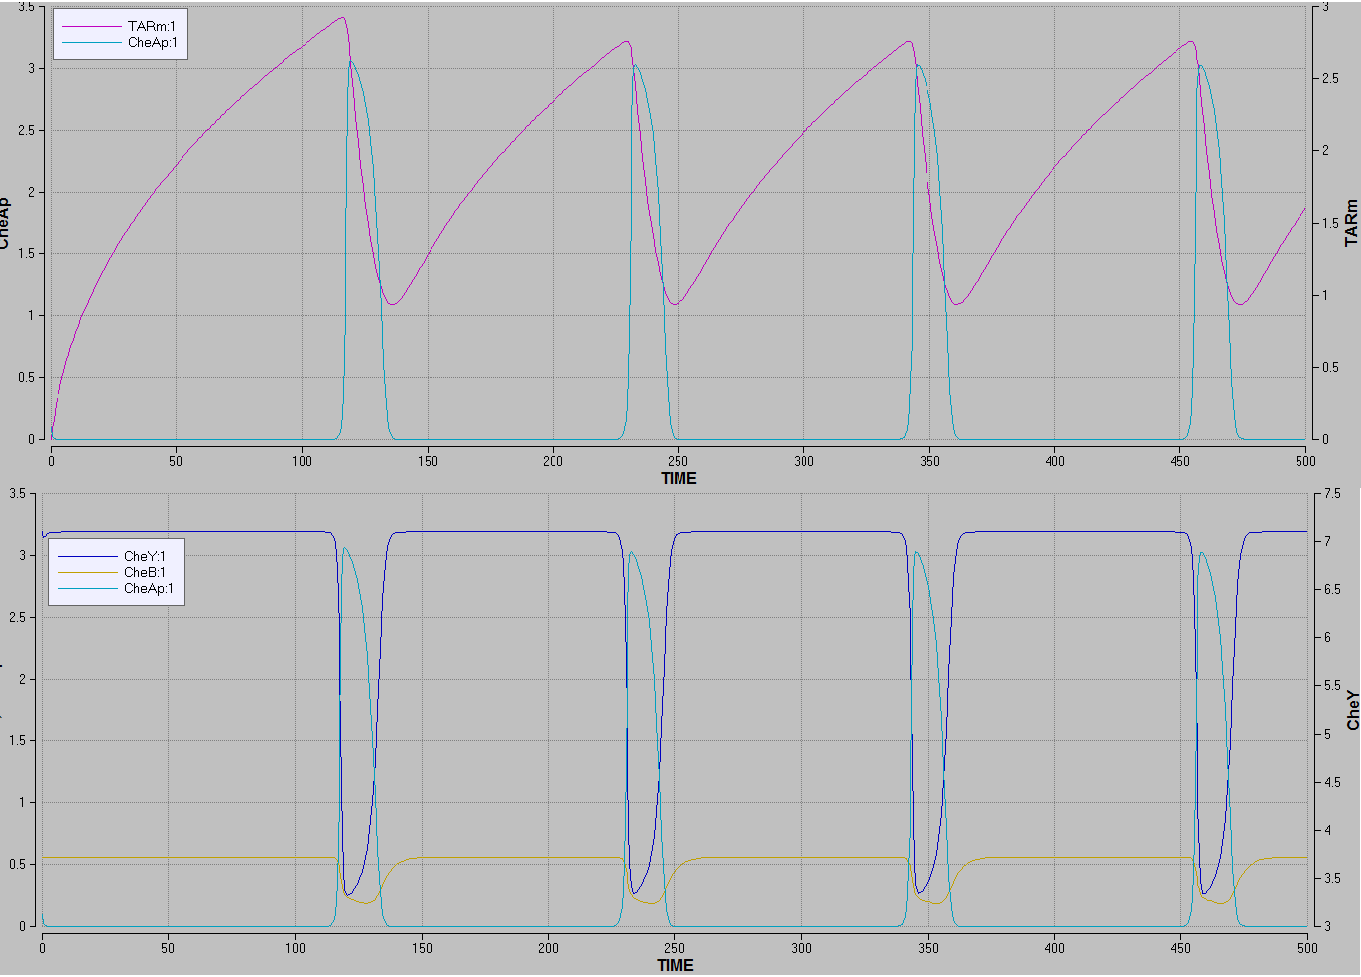
Figure 5:
The top graph is showing the concentration of phosphorylated CheA rising when the concentration of methylated TSR drops.
The bottom graph is showing the concentrations of CheB and CheY rising when the concentration of phosphorylated CheA rises.
Focusing on the CheA/CheAp behaviour in the model (The top graph in figure 5), it demonstrates that the CheA auto-phophorylation rate rises when no TAR is methylated, thus producing phosphorylated CheA.
The dephosphorylation of CheA, is performed by both CheB and CheY (the bottom graph in figure 5), rise as the concentrations of both phosphorylated CheB and CheY rise and thereby decreases the concentration of phosphorylated CheA.
This corresponded well with the known theory for the real system.
Focusing on the CheB/CheBp behaviour in the model which illustrate that concentrations of phosphorylated CheB rises when phosphorylated CheA is present, as seen in figure 5 and its dephosphorylation occurs during the demethylation of TAR as seen in figure 4.
This corresponded well with the known theory for the real system.
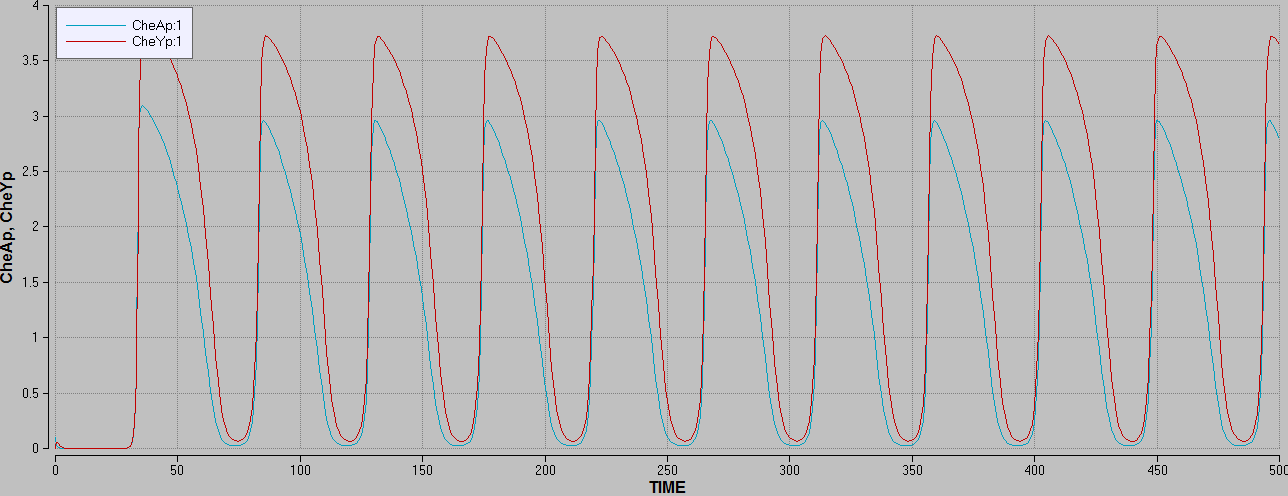
Figure 6: graph showing is showing the concentration of CheY rising when the concentration of phosphorylated CheA rises.
Focusing on the CheY/CheYp and the flagella motor rotational direction the model illustrates that when concentrations of phosphorylated CheA rises, the concentrations of phosphorylated CheY rises and the flagellar activates clockwise rotation.
The concentration of phosphylated CheY is proportional to the flagella motor rotational direction, because phosphylated CheY activates Clockwise rotation in the flagellar motors which without phosphylated CheY turns Counter Clockwise.
The CheY er constantly dephosphorylated by CheZ, which in this case is modelled as the constant k.
This corresponded well with the known theory for the real system.
This is a simplified model and does only describe a small part of the real system, this makes the data produced by the model useless as prediction for actual bacterial behaviour.
Also the too large time scale is making it impossible too describe what happens when the photosensor in the cell is activated by light.
When trying too introduce the photosensor and the affect of light in the model, the increase in light doesn’t change the system behaviour to a degree that affects the output of the program.
This might be because the concentration of the enzymes, the rate constants in the model and the other model parameters have been set to high or to low.
Although several problems exist in the model it is still good enough to model the system behaviour and enzyme interaction on a larger timescale, then seen in nature.
References
[1] Suzanne R. Lybarger, Janine R. Maddock [http://jb.asm.org/cgi/reprint/183/11/3261 Polarity in Action: Asymmetric Protein Localization in Bacteria] journal of bacteriology (2001) 3261-3267
[2] M.J. Tindall, S.L. Porter, P.K. Maini, G. Gaglia, J.P. Armitage [http://www.springerlink.com/content/f602r72767124602/ Overview of Mathematical Approaches Used to Model Bacterial Chemotaxis I: The Single Cell] Bulletin of Mathematical Biology (2008) 70: 1525–1569
[3] Nikita Vladimirov, Linda Løvdok, Dirk Lebiedz, Victor Sourjik [http://www.ploscompbiol.org/article/info%3Adoi%2F10.1371%2Fjournal.pcbi.1000242 Dependence of Bacterial Chemotaxis on Gradient Shape and Adaptation Rate] Computational Biology (2008) 4(12): e1000242
 "
"


