Team:WITS-South Africa/Machine Design
From 2010.igem.org
| Line 58: | Line 58: | ||
==Machine Testing== | ==Machine Testing== | ||
<br /> | <br /> | ||
| + | |||
| + | All of our constructs contained different fluorescent protein markers. We added these in order to gain some preliminary data on the behaviour of our machines using fluorescent microscopy. All images were obtained using | ||
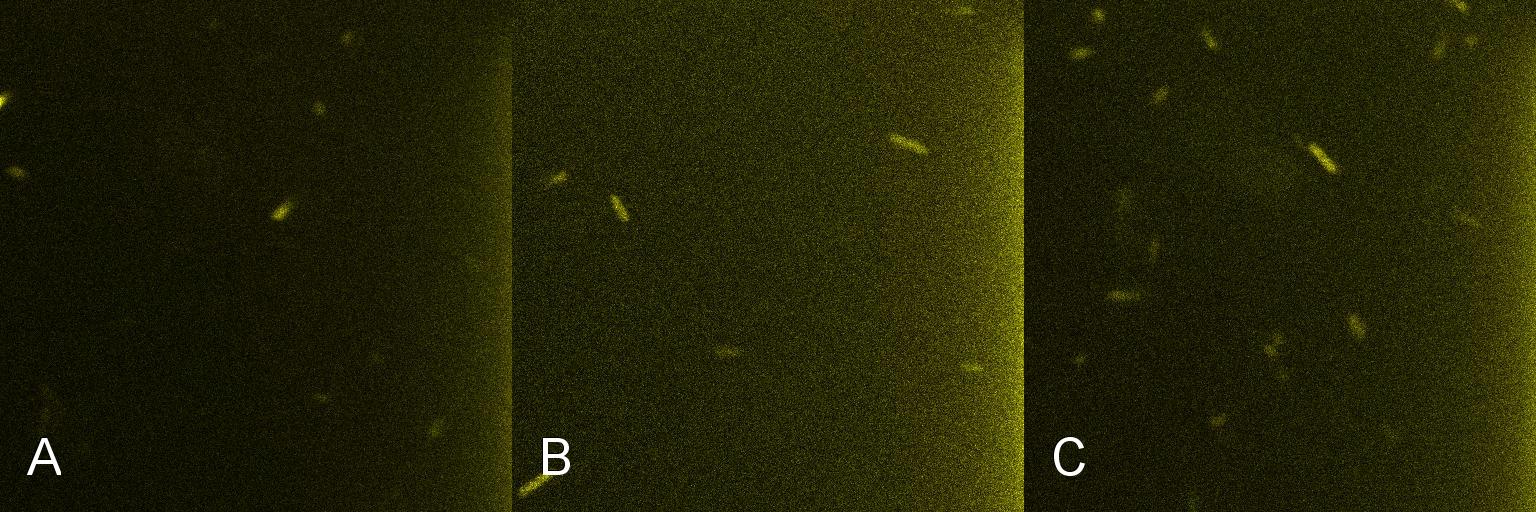
A culture of 2ml of ''E. coli'' containing Lacto-detect was grown overnight at 37°C and then transferred to 25 ml of ampicillin LB broth. This culture was then grown at 37°C in a shaking incubator for 2.5 hours so as to ensure that the bacteria were in their exponential growth phase. A baseline reading (Fig 4) was taken at this point (Tile A), to determine the presence of non-specific promoter activation. 10% 1mM IPTG was then added and the culture returned to the shaking incubator. An aliquot was then imaged after 30min (Tile B), and again after 1 hour (Tile C). All aliquots used in imaging were 100 ul. | A culture of 2ml of ''E. coli'' containing Lacto-detect was grown overnight at 37°C and then transferred to 25 ml of ampicillin LB broth. This culture was then grown at 37°C in a shaking incubator for 2.5 hours so as to ensure that the bacteria were in their exponential growth phase. A baseline reading (Fig 4) was taken at this point (Tile A), to determine the presence of non-specific promoter activation. 10% 1mM IPTG was then added and the culture returned to the shaking incubator. An aliquot was then imaged after 30min (Tile B), and again after 1 hour (Tile C). All aliquots used in imaging were 100 ul. | ||
| + | |||
As is seen in the baseline image (Tile A), the degree of fluorescent activation is minimal before the addition of IPTG. Tile B shows the fluorescent activation after 30min incubation with IPTG - there is very little visible fluorescent activation. After an hour of incubation (Tile C) there is a marked increase in the degree of fluorescence, thus providing an indication that IPTG has a positive effect on the Lac/Ara-1 promoter, activating gene expression. <br /> <br /> | As is seen in the baseline image (Tile A), the degree of fluorescent activation is minimal before the addition of IPTG. Tile B shows the fluorescent activation after 30min incubation with IPTG - there is very little visible fluorescent activation. After an hour of incubation (Tile C) there is a marked increase in the degree of fluorescence, thus providing an indication that IPTG has a positive effect on the Lac/Ara-1 promoter, activating gene expression. <br /> <br /> | ||
| Line 64: | Line 67: | ||
'''Figure 4. Time course fluorescent microscopy of Lacto-detect before and after induction with IPTG''' <br /> <br /> <br /> | '''Figure 4. Time course fluorescent microscopy of Lacto-detect before and after induction with IPTG''' <br /> <br /> <br /> | ||
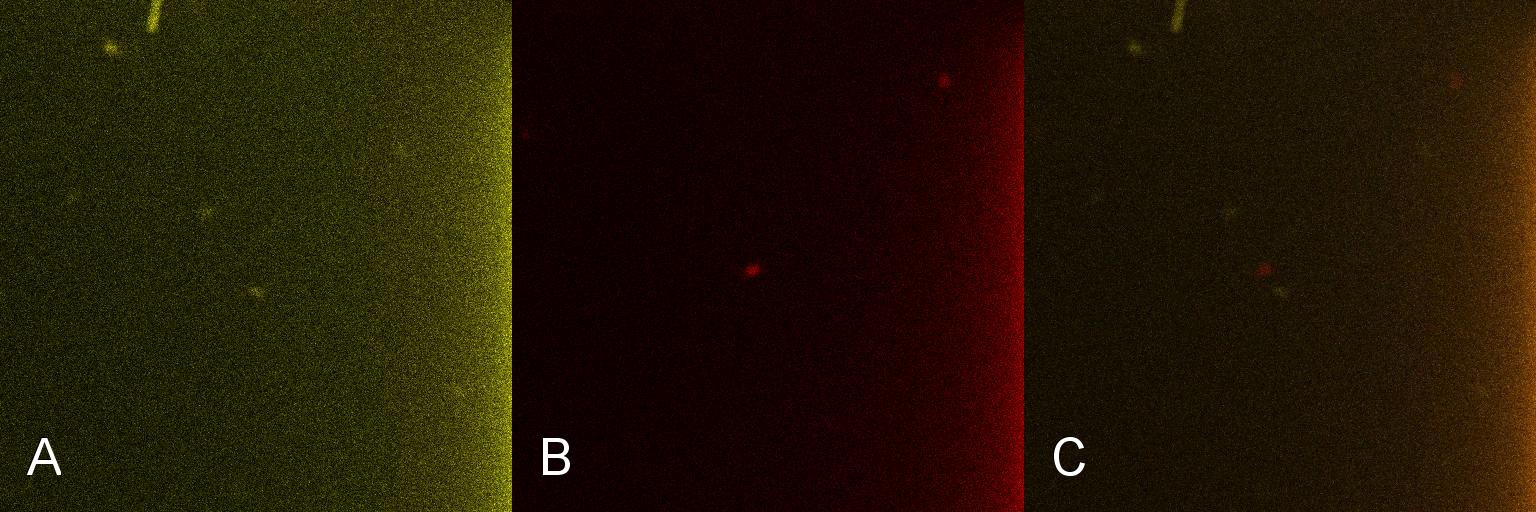
| - | Once the induction of Lacto-detect had reached an appreciable level, it was added to an aliquot of ''B. subtilis'' containing | + | Once the induction of Lacto-detect had reached an appreciable level, it was added to an aliquot of ''B. subtilis'' containing the Lacto-test construct and imaged(Fig 2). Baseline images of both Lacto-detect (tile A) and the ''B. subtilis'' population (tile B) are given as well as a combined fluorescent image of both populations from the same imaged aliquot (tile C). The degree of activation (tile A) of Lacto-detect is appreciable due to the previous activation with IPTG, while the observed activation of the ''B. subtilis'' population is the baseline image (tile B) with no significant observable induction. <br /> <br /> |
[[Image:Montage_of_Mixed.jpg|850px]] <br /> | [[Image:Montage_of_Mixed.jpg|850px]] <br /> | ||
Figure 2 <br /> <br /> <br /> | Figure 2 <br /> <br /> <br /> | ||
Revision as of 18:32, 27 October 2010

Contents |
The Machines
Lacto-detect
This genetic machine within a population of bacteria will prime these bacteria to act as ‘Detectors’. It causes the production of a quorum signalling peptide in response to an input signal, which activates another machine, Lacto-report.
Figure 1. The Lacto-sense construct
So how did we end up selecting the final parts of our Machines? Each one was chosen after much consideration and scouring of the literature to select the most suitable biological system. For a design rationale of why we selected the parts that we did to create this machine, click here
For an account of how we assemblied and verified Lacto-detect, click here
Lacto-report
This genetic machine is present in a second bacterial population, mixed in with the first. The quorum peptide produced when Lacto-sense is activated will be imported into the bacterial cells containing this machine and induce expression of this construct. This will have several effects:
- Production of more quorum peptide, to activate neighbouring cells and produce a positive feedback loop
- Production of a chromogenic reporter compound which is visible to the naked eye
- Production of a negative regulator which will block the binding of the quorum peptide and create a negative feedback loop, resetting the system to a negative state
Figure 2. The Lacto-report construct
For a design rationale of why we selected the parts that we did to create this machine, click here
We were not able to finish constructing Lacto-report in it's entirety, due to time constraints and issues with the E.chromi Biobrick parts. (For more details, click here.)
For testing and characterising the behaviour of the quorum sensing mechanism in a model Gram-positive bacillus, we used an intermediate machine construct we dubbed Lacto-test.
Lacto-test
This construct is a simplified of version of Lacto-report. When transformed into a Gram-positive bacteria, the presence of the PlcR promoter will allow us to determine if the PlcR-PapR quorum peptide can be correctly processed, imported into the cell and whether or not it activates the promoter. This can be determined by visualising expression of mCherry in a mixed culture of Lacto-detect and Lacto-report, after the addition of an inducer for Lacto-detect.
Figure 3. The Lacto-test construct
Machine Testing
All of our constructs contained different fluorescent protein markers. We added these in order to gain some preliminary data on the behaviour of our machines using fluorescent microscopy. All images were obtained using A culture of 2ml of E. coli containing Lacto-detect was grown overnight at 37°C and then transferred to 25 ml of ampicillin LB broth. This culture was then grown at 37°C in a shaking incubator for 2.5 hours so as to ensure that the bacteria were in their exponential growth phase. A baseline reading (Fig 4) was taken at this point (Tile A), to determine the presence of non-specific promoter activation. 10% 1mM IPTG was then added and the culture returned to the shaking incubator. An aliquot was then imaged after 30min (Tile B), and again after 1 hour (Tile C). All aliquots used in imaging were 100 ul.
As is seen in the baseline image (Tile A), the degree of fluorescent activation is minimal before the addition of IPTG. Tile B shows the fluorescent activation after 30min incubation with IPTG - there is very little visible fluorescent activation. After an hour of incubation (Tile C) there is a marked increase in the degree of fluorescence, thus providing an indication that IPTG has a positive effect on the Lac/Ara-1 promoter, activating gene expression.

Figure 4. Time course fluorescent microscopy of Lacto-detect before and after induction with IPTG
Once the induction of Lacto-detect had reached an appreciable level, it was added to an aliquot of B. subtilis containing the Lacto-test construct and imaged(Fig 2). Baseline images of both Lacto-detect (tile A) and the B. subtilis population (tile B) are given as well as a combined fluorescent image of both populations from the same imaged aliquot (tile C). The degree of activation (tile A) of Lacto-detect is appreciable due to the previous activation with IPTG, while the observed activation of the B. subtilis population is the baseline image (tile B) with no significant observable induction.

Figure 2
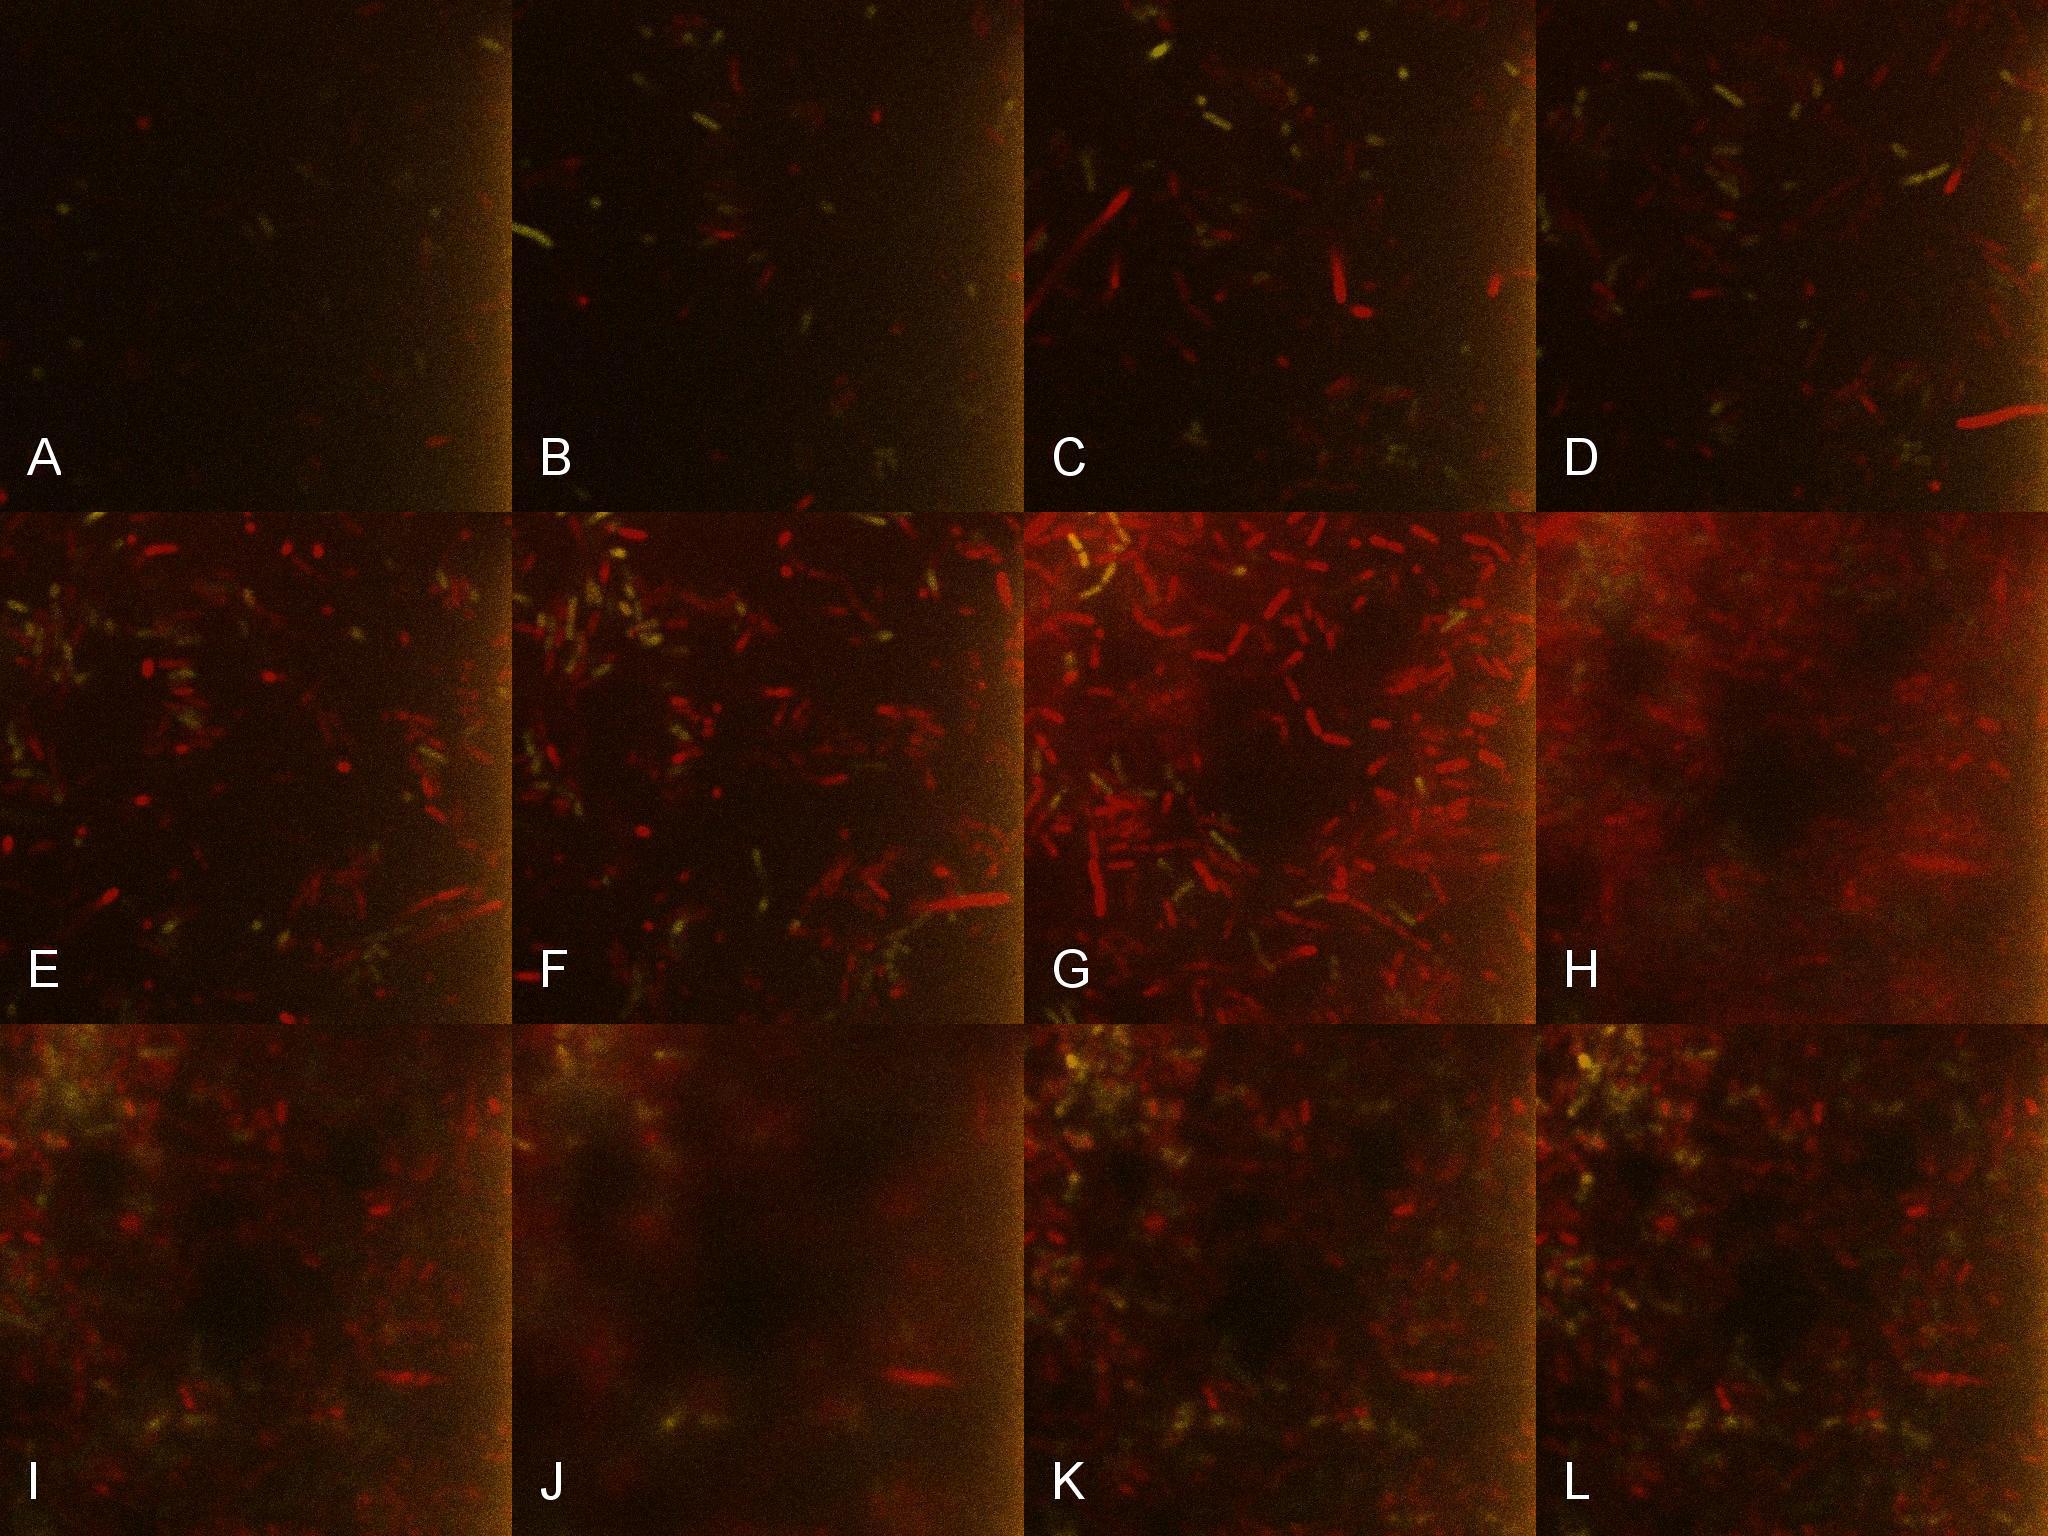
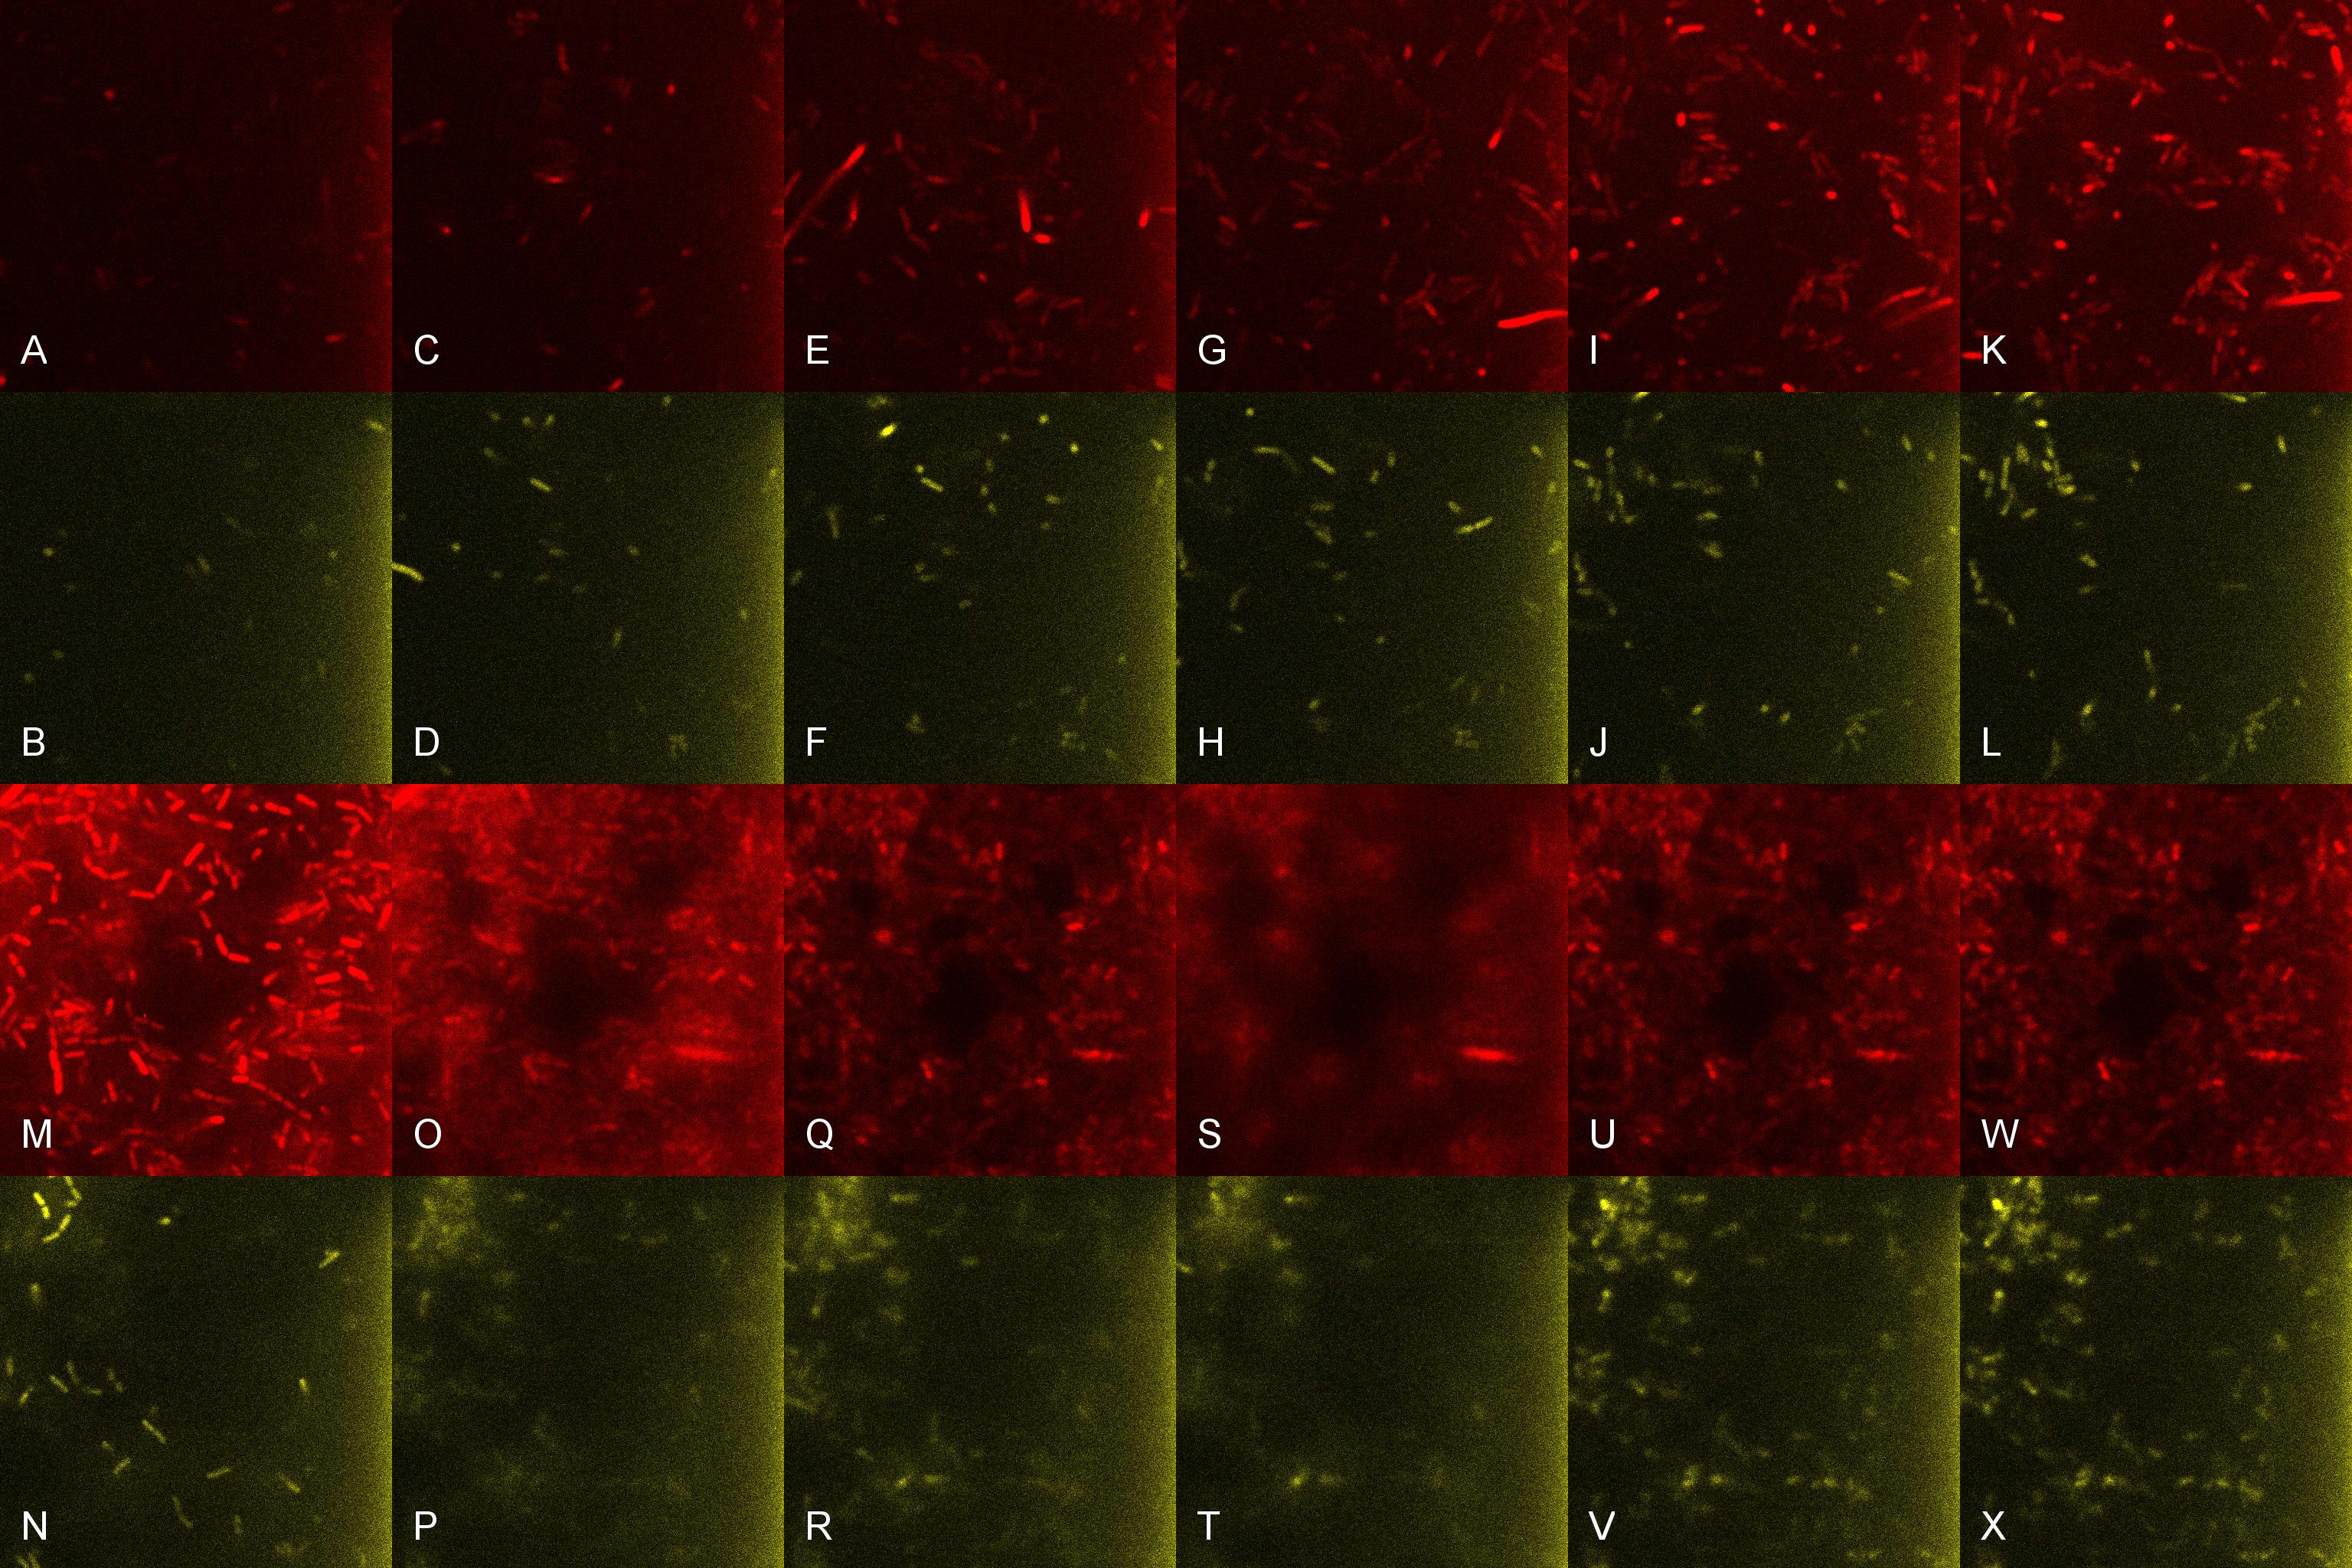
Once the induced aliquot of Lacto-detect was added, the combined aliquot was imaged at 30min intervals for 6hours so as to show the activation of the PlcR-driven B. subtilis population by Lacto-detect (figure 3). Figure 4 shows the imaged aliquot from Figure 3 with the Venus and mCherry fluorescent channels separated and presented at each epoch as alphabetical sets - A&B, C&D etc. This is done as to fully appreciate the direct induction of the B. subtilis population by Lacto-detect. Taking particular note of tile G of Figure 3 and the corresponding tiles M&N of Figure 4 (after 3.5h), there is marked increase in mCherry fluoresence. This is indicative of the active communication between Lacto-detect and the PlcR B. subtilis population, thus illustrating the efficacy of the PlcR-PapR quorum network.

Figure 3

Figure 4
 "
"


