Team:Brown/Modeling/Results
From 2010.igem.org
(→Results) |
|||
| (One intermediate revision not shown) | |||
| Line 1: | Line 1: | ||
{{:Team:Brown/templates/header}} | {{:Team:Brown/templates/header}} | ||
| - | + | =Results= | |
This page will discuss the insight gained through our mathematical modeling. | This page will discuss the insight gained through our mathematical modeling. | ||
| Line 25: | Line 25: | ||
===== State 2 ===== | ===== State 2 ===== | ||
The following is the above graph with S2 protein included, signaling the entrance of the circuit into the second state after a sufficient quantity of CI has been produced. | The following is the above graph with S2 protein included, signaling the entrance of the circuit into the second state after a sufficient quantity of CI has been produced. | ||
| - | [[Image: | + | [[Image:S1s2CI.jpg | 600px | center]] |
===== State 3 ===== | ===== State 3 ===== | ||
Latest revision as of 16:22, 27 October 2010
Results
This page will discuss the insight gained through our mathematical modeling.
|
As our circuit is complicated and involved many transcription factors and reporting proteins (see above), results are separated into the modular parts of our circuit.
Results
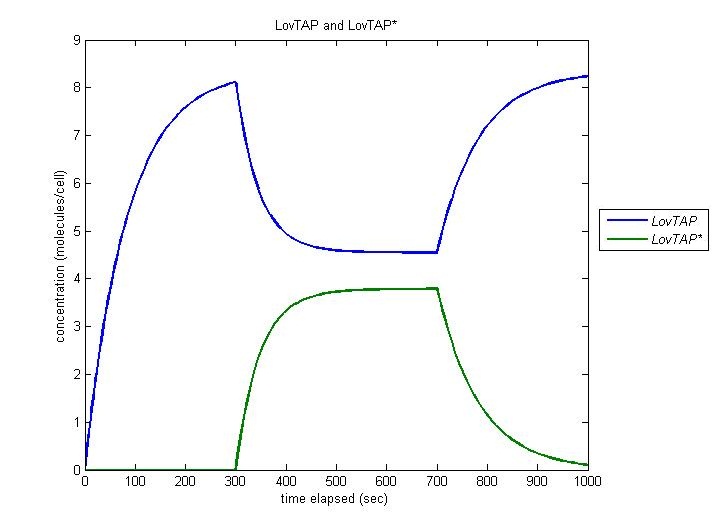
LovTAP to LovTAP*
Our entire circuit depends on the conversion of LovTAP to LovTAP* by light. In this simulation, the cell is irradiated at t=300 and this irradiation is ceased at t=700. We observe function as desired, with the concentration of LovTAP as it converts to LovTAP*, and decreasing when the light is turned off.
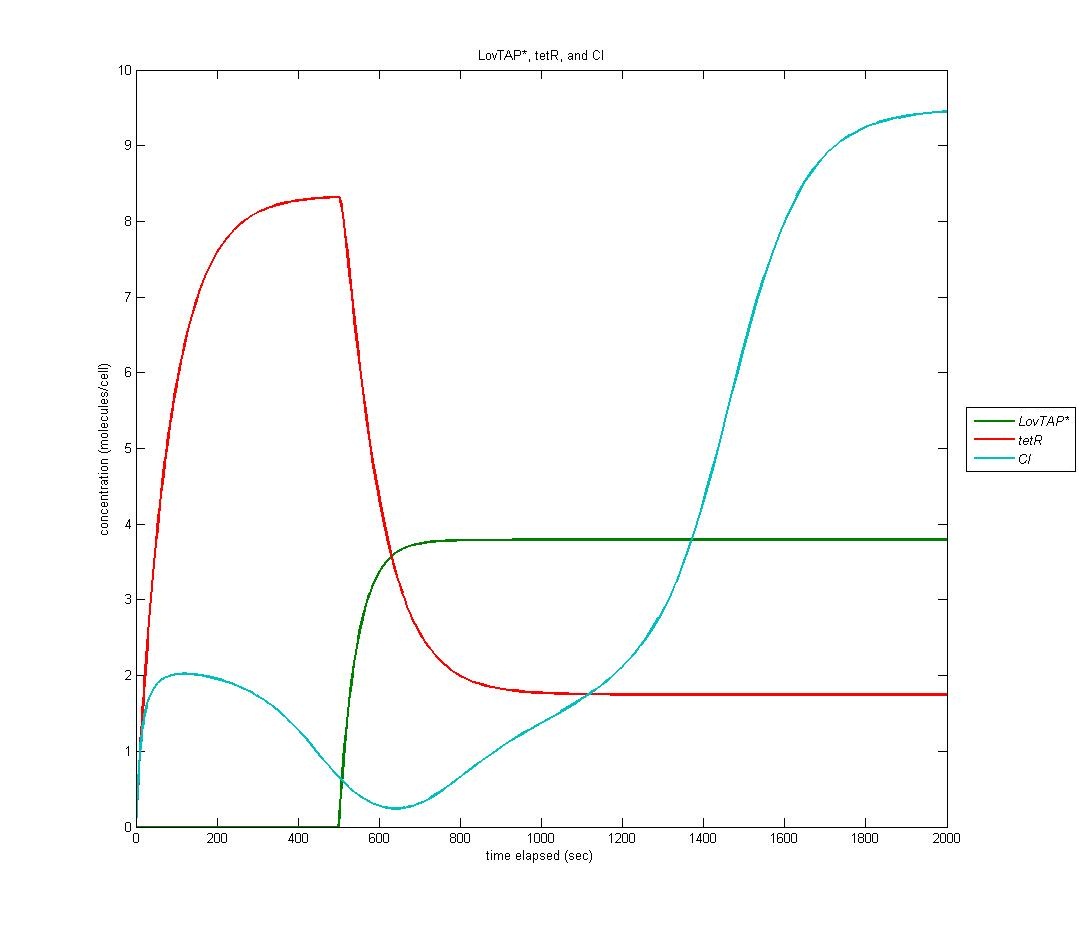
LovTAP* to CI
Because LovTAP* is a repressor and we desired light induced induction, we make use of an altered version of the double-repression system designed by EPF-Lausanne. Thus, when LovTAP* represses the TrpR promoter, tetR is no longer produced, allowing production of CI+AraC+Mnt. The graph below shows LovTAP* in green, tetR in red, and CI in cyan. As we can see, the increase in LovTAP* decreases tetR and CI then increases, as desired.
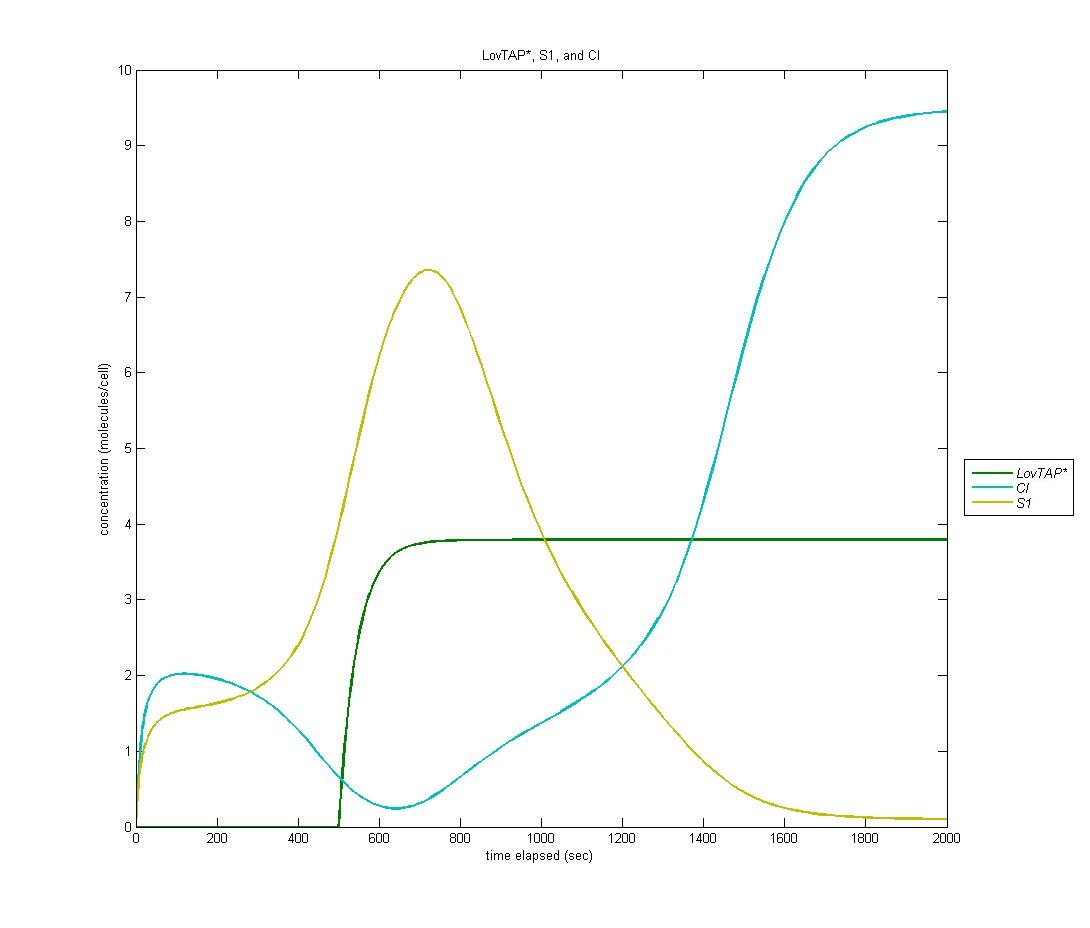
State 1
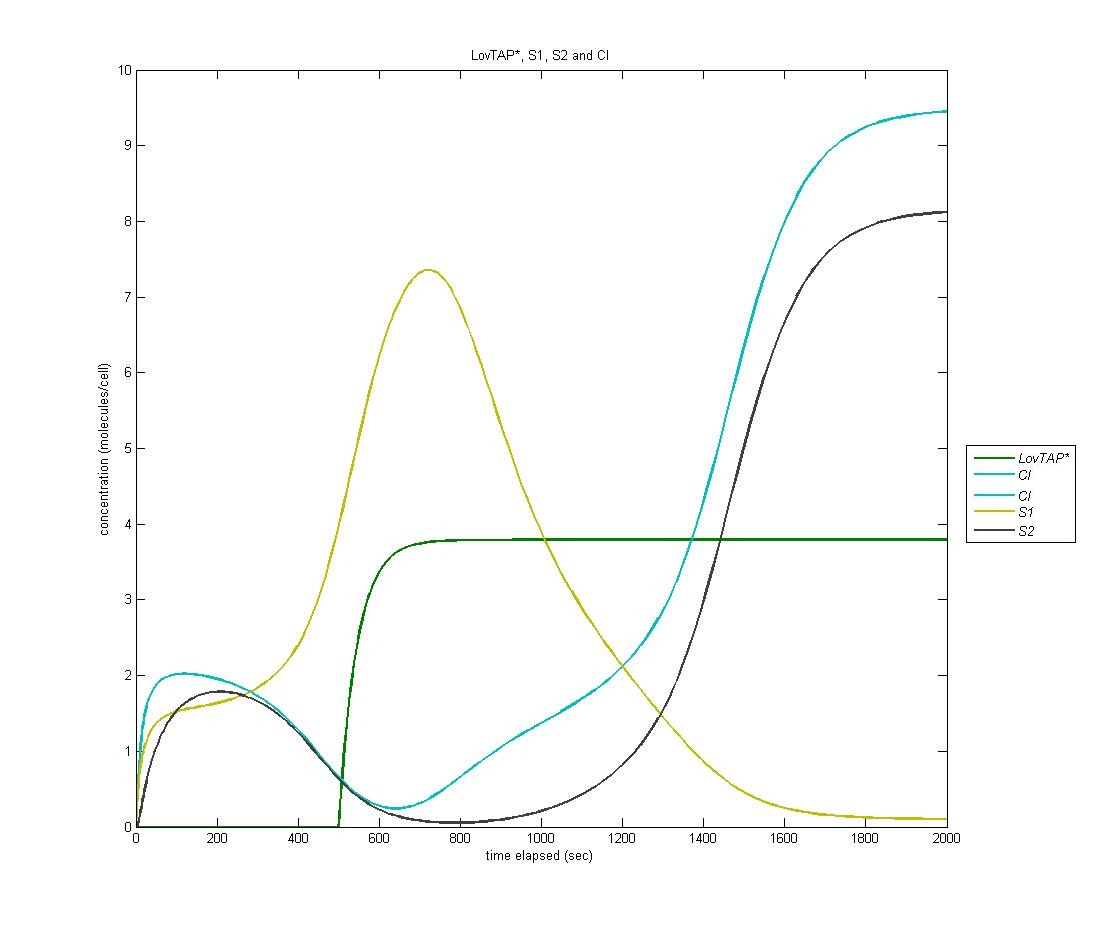
Our first state is on by default; it is the ‘reset’ state of the bi-stable switch. In the graph below, LovTAP* is in green, S1 is in yellow, and CI is in cyan. As we can see, the S1 protein gradually increases at first. When LovTAP* begins to increase in concentration, CI is produced which flips the bi-stable switch; thus, the concentration of S1 decreases.
State 2
The following is the above graph with S2 protein included, signaling the entrance of the circuit into the second state after a sufficient quantity of CI has been produced.
State 3
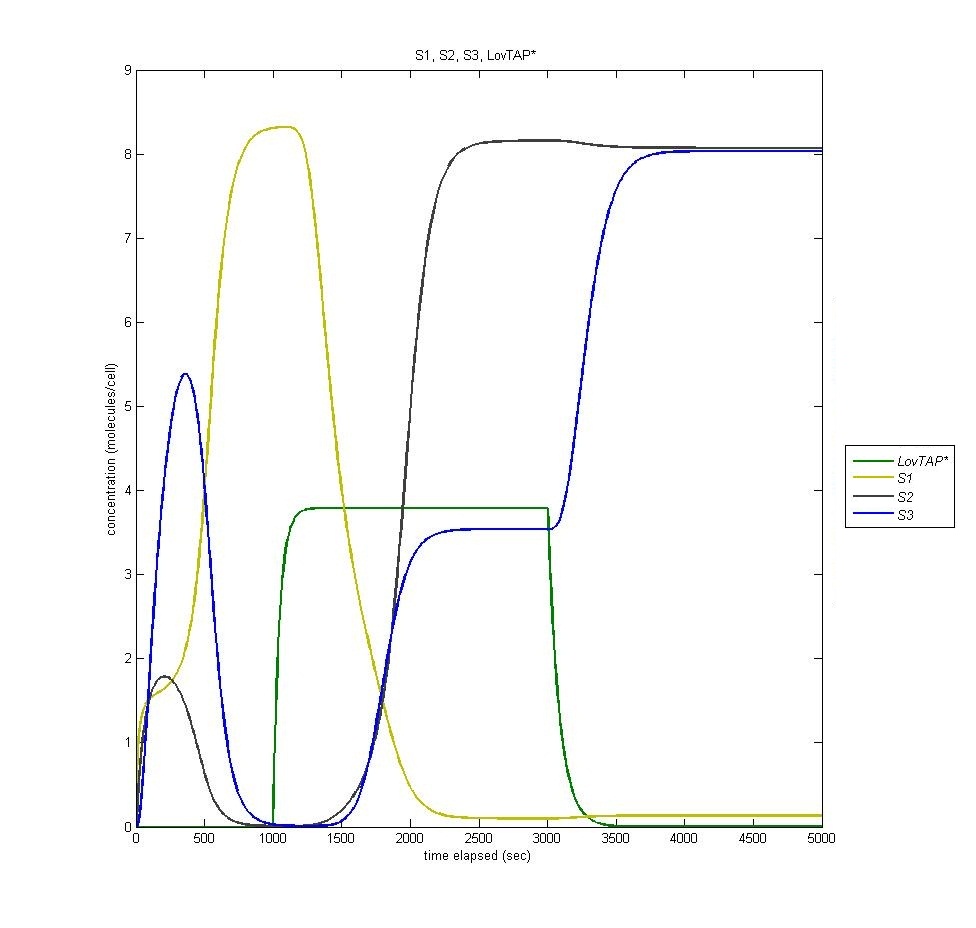
State three is triggered by the introduction of LacI, which is produced in the second state of the bi-stable switch. In the following graph it is visible how the introduction of Light (it is clear when the light is on by the presence of LovTAP*, in green) switches from state 1 to state 2, and how the termination of that light switches the cell to state three. Notice that state 2 remains active even when state 3 is activated.
State 4
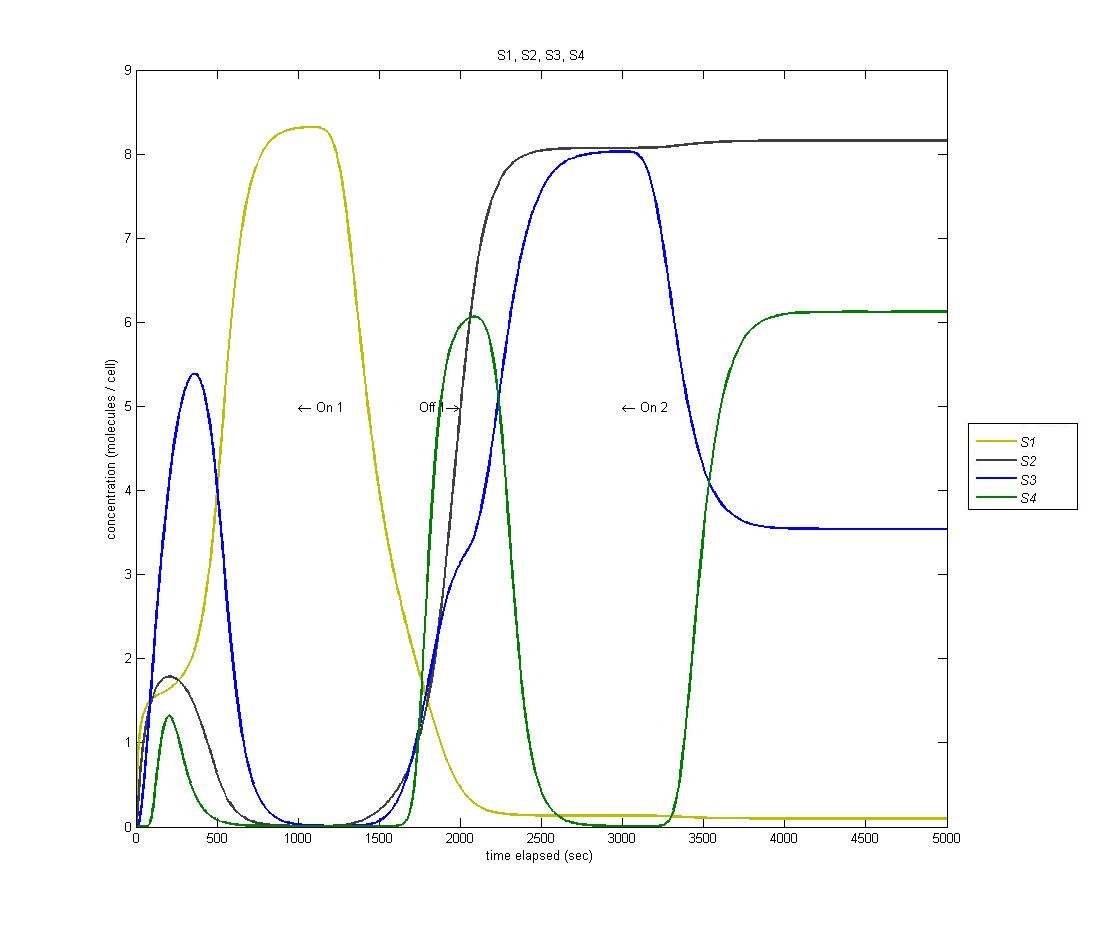
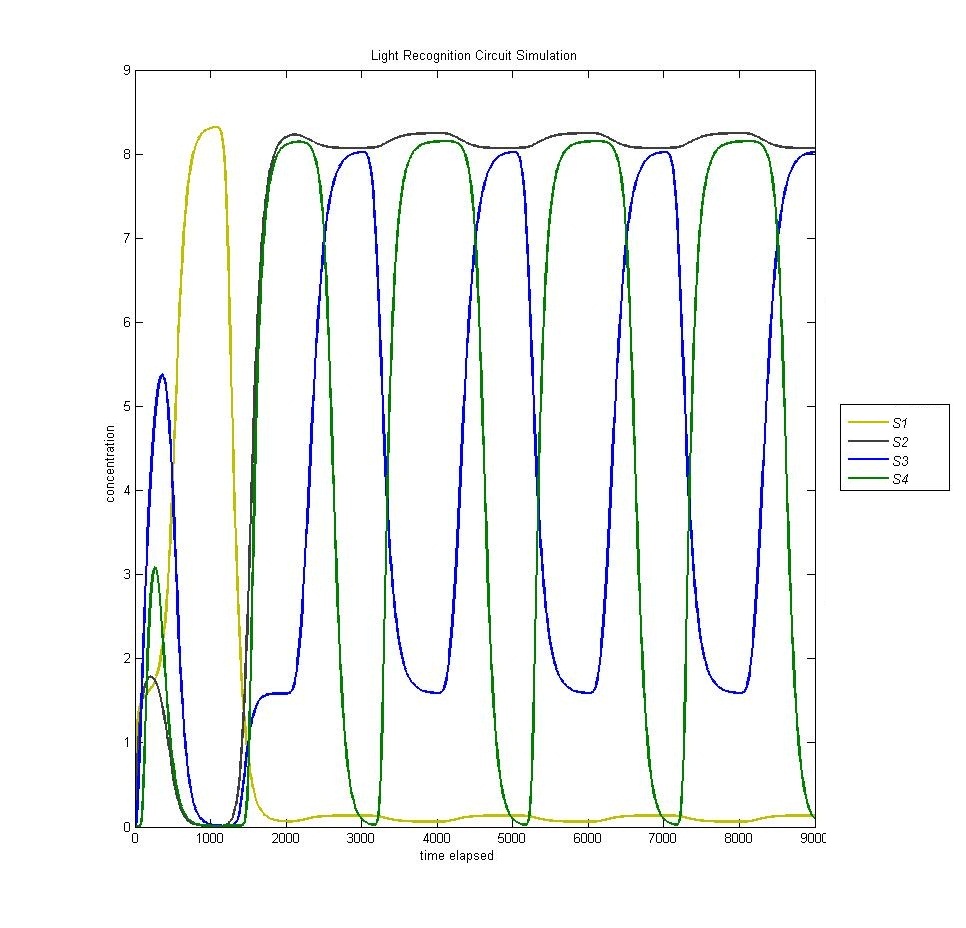
State 4 is triggered through our AND gate, which is adopted from the PKU 2009 iGEM team. When the light is turned on for the second time, we expect to enter our fourth state. However, as we can see from the below graph (S1 is yellow, S2 is black, S3 is blue, S4 is green) we actually enter state 4 BEFORE state 3.
This is a problem with the biological functions underlying our circuit. We have traced this problem to the fact that our hybrid LacI inducible / Mnt repressible promoter that we were using is not sufficiently repressed by Mnt to prevent activation of the fourth state, which is then magnified through our AND gate.
Caveats
Despite our lack of solid parameters based on our own experimental data, we were able to find several issues with our circuit design with parameters based on literature and estimated.
State 4 before State 3
Firstly, we find that our circuit enters state 4 before state 3. Using the information from our model, we were able to trace this problem to a lack of sufficient repression of the Mnt-repressable promoter by Mnt.
To verify this, we simply artificially increased the binding affinity of Mnt to the Mnt-repressable promoter in our model, which means we decreased the K_d. In the result, which is below, we can see that our hypothesis was indeed correct and this in this situation state 4 (green) occurs after state 3 (blue), although it appears as though expression of S3 is limited by this.
Circuit (lack of) Reset
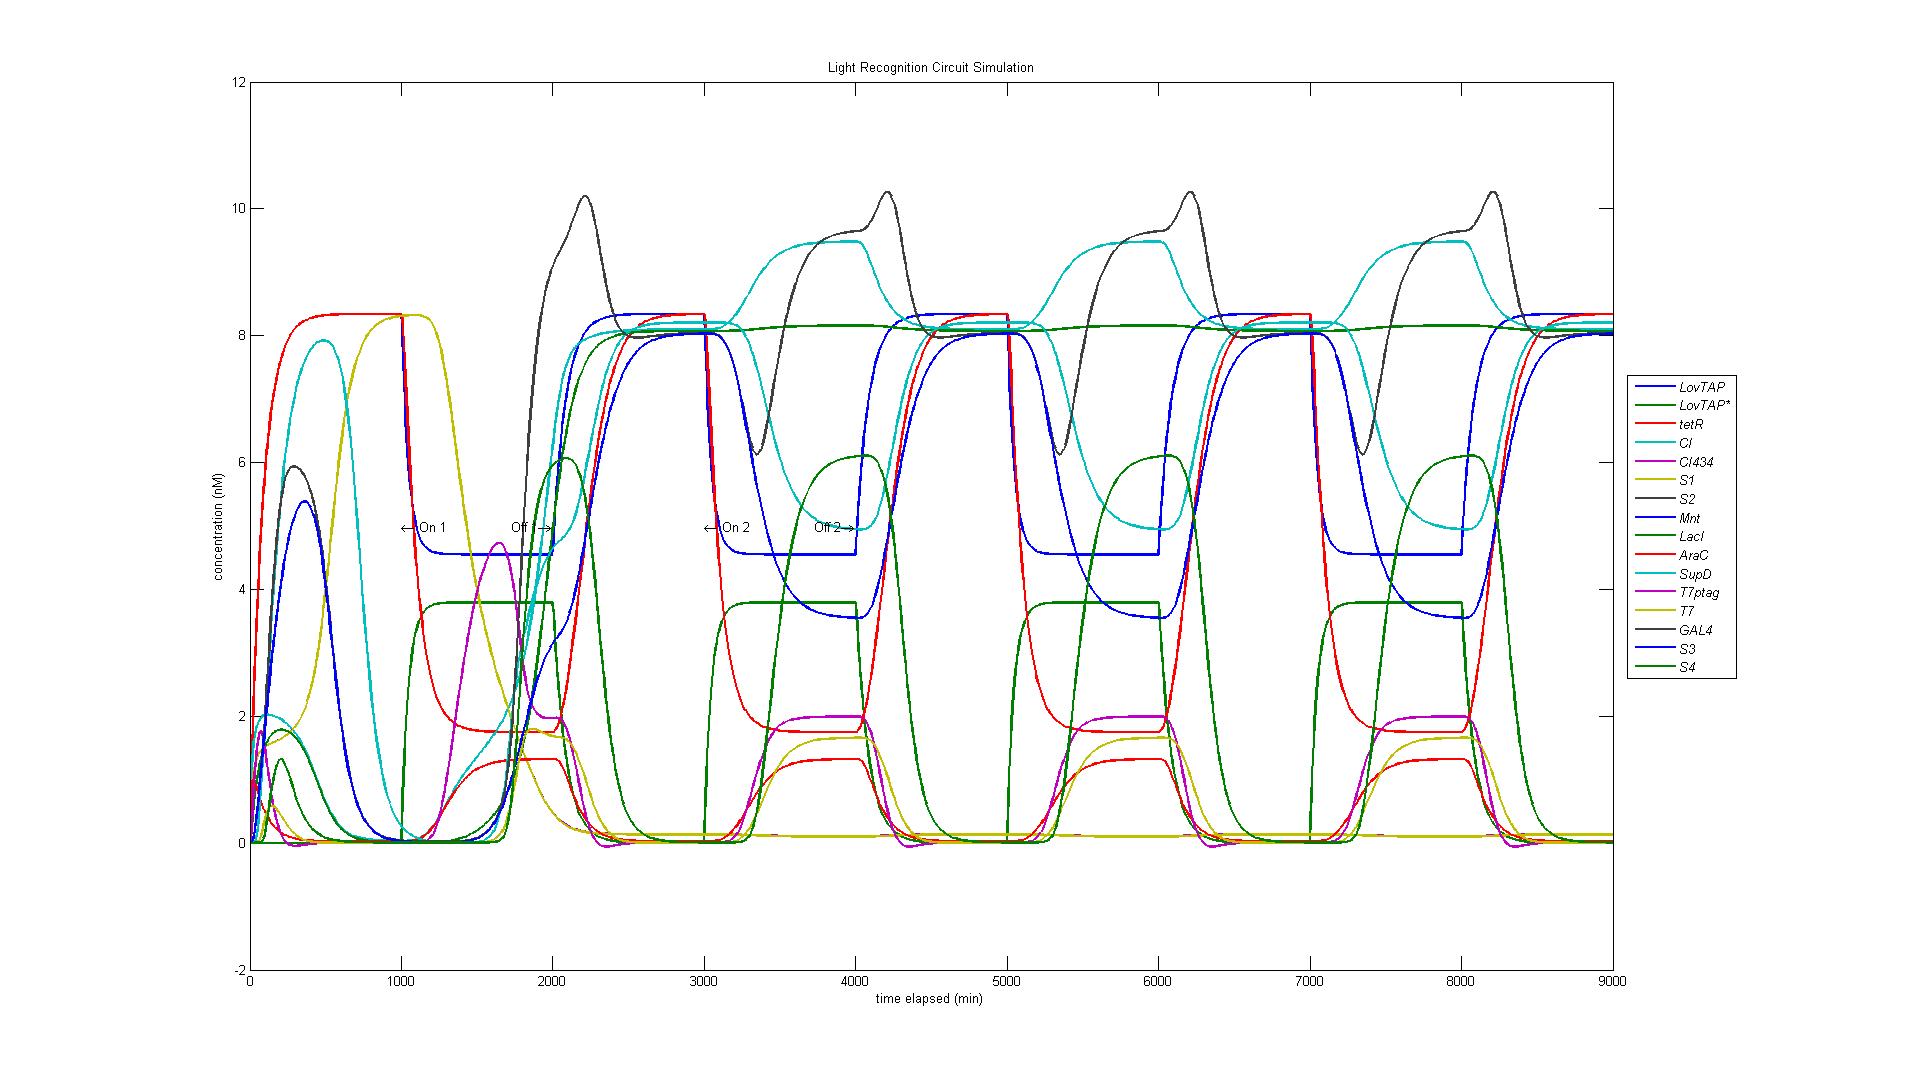
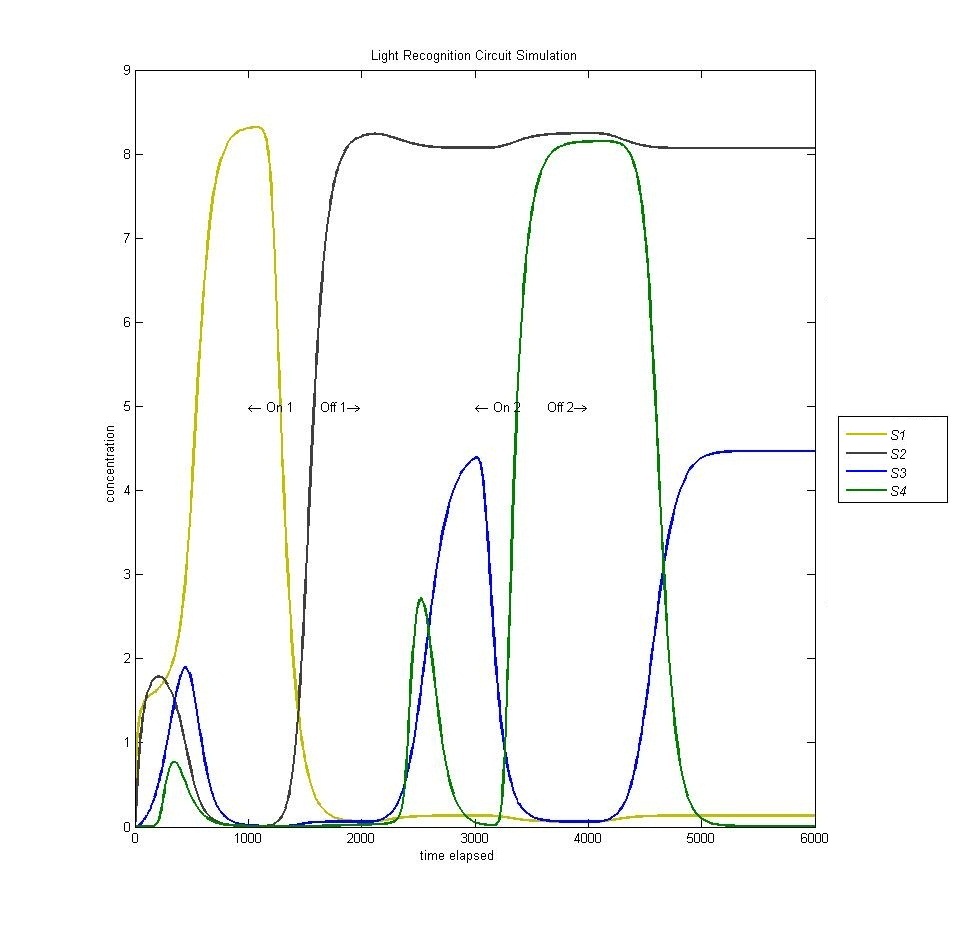
In the original design of our circuit, we had hoped to create a resettable circuit. We speculated that the circuit would become stuck in the ultimate and penultimate states. Unsure of the activity of our circuit beyond the fourth state, we turned to our model. Simulating a cell with multiple light and dark phases, we observed the following, which validated our earlier thoughts that the circuit would be 'stuck' in states 3 and 4 and would only enter the first two states once.
Speculations
In order to obtain a fully functional circuit, our mathematical model implies we must pay attention to several details:
- We should utilize directed evolution, placing the Mnt-repressable promoter behind a kill cassette, and select over several generations for increased repression. This would solve our state disorder problem. Alternatively, we could allow state 4 to 'be' state 3, although this would require more modeling and physical experimentation to ensure robustness.
- We should introduce a reset feature; this could be accomplished through the addition of a CI434 gene to state 4.
- We should (ideally) generate parameters for our system with our own experimental data to ensure its accuracy.
- We should model our system with a stochastic method to ensure both mathematical systems exhibit the same behavior, the we could be more confident in the robustness of our system.
 "
"
