Team:TU Delft/11 August 2010 content
From 2010.igem.org
Contents |
Documentary Filming
For the filming of some shots for the documentary [http://www.whoownsyoufilm.com "Who owns you"], David Koepsel and Taylor Roesch came by in the lab. Some pictures:
Why so serious?
Discussion group:
Lab work
Alkane degradation
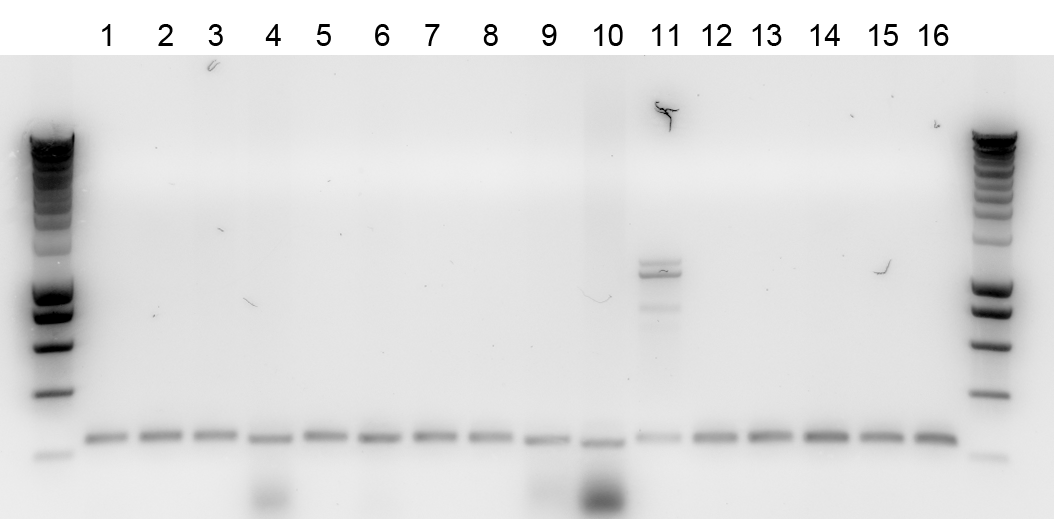
The colony PCR run overnight on colonies possibly containing BioBrick 020A were checked on gel, but unfortunately none of the products had the correct length (2482bp). We will try to make the BioBrick again tomorrow.

Lane description
| # | Description | Primers | Expected length (bp) | ✓ | ✗ |
| L | SmartLadder | n/a | n/a | n/a | n/a |
| 1-16 | 020A | G00100 + G00101 | 2482 | none | all |
| L | SmartLadder | n/a | n/a | n/a | n/a |
Tolerance and Sensing
The morning started with a Colony PCR of the plates of yesterday.
Lane description:
| # | Description | Primers | Expected length (bp) | Status |
| M | SmartLadder | n/a | n/a | n/a |
| 1-5 | 304 | G00100 + G00101 | 342 | ✗ |
| 6-10 | 327 | G00100 + G00101 | 310 | ✗ |
| 11-12 | 405 | G00100 + G00101 | 1320 | ✗ |
Unfortunately all colonies were negative. This is probably the result of the backbone ligation without an insert. It seems that the two way ligation is not working as well as we hoped it would.
All lanes show the same band at about the height of 240 bp. This might be due to a contamination. I will try to find the source as soon as possible.
Modelling of hydrocarbon sensing
To characterize the hydrocarbon sensing system (AlkS and promotors), a model has to be build that
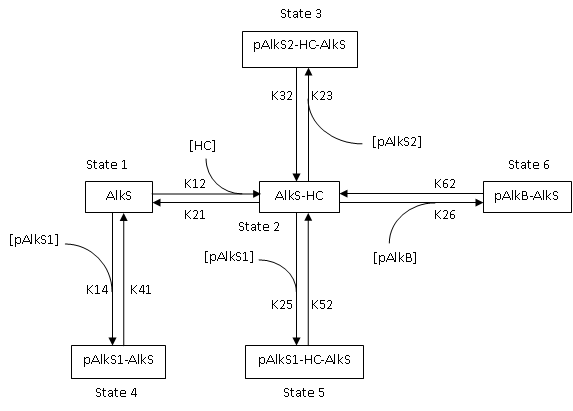
describes the GFP and RFP expression that will be measured with the plate reader. The AlkS protein can bind to various promotors (PAlkS1, PAlkS2, PAlkB) and hydrocarbons. This results in the following protein state diagram:

Part of the constants will have to be assumed, and hopefully some can be estimated from plate reader expression data.
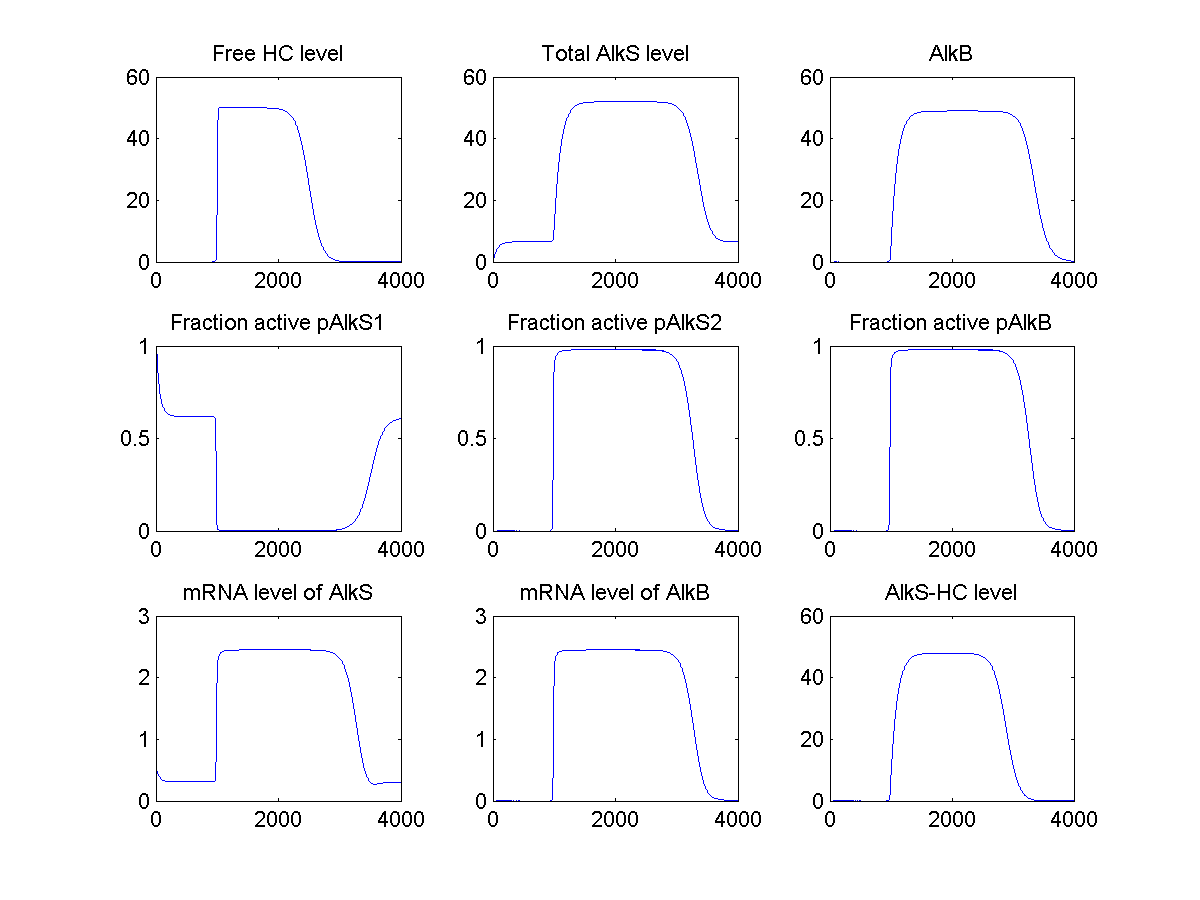
Matlab implementation of this model, and some initial guesses for constants results in the following graphs:
It shows that the model correctly maintains a basal level of AlkS when there are no hydrocarbons (HC), and increases to a high level when HC are added.
 "
"


