Team:Imperial College London/Modelling/Protein Display/Results and Conclusion
From 2010.igem.org
(Difference between revisions)
(Adding the frames to the pictures) |
m |
||
| Line 15: | Line 15: | ||
|[[Image:IC_Protein_display.png|600px]] | |[[Image:IC_Protein_display.png|600px]] | ||
|- | |- | ||
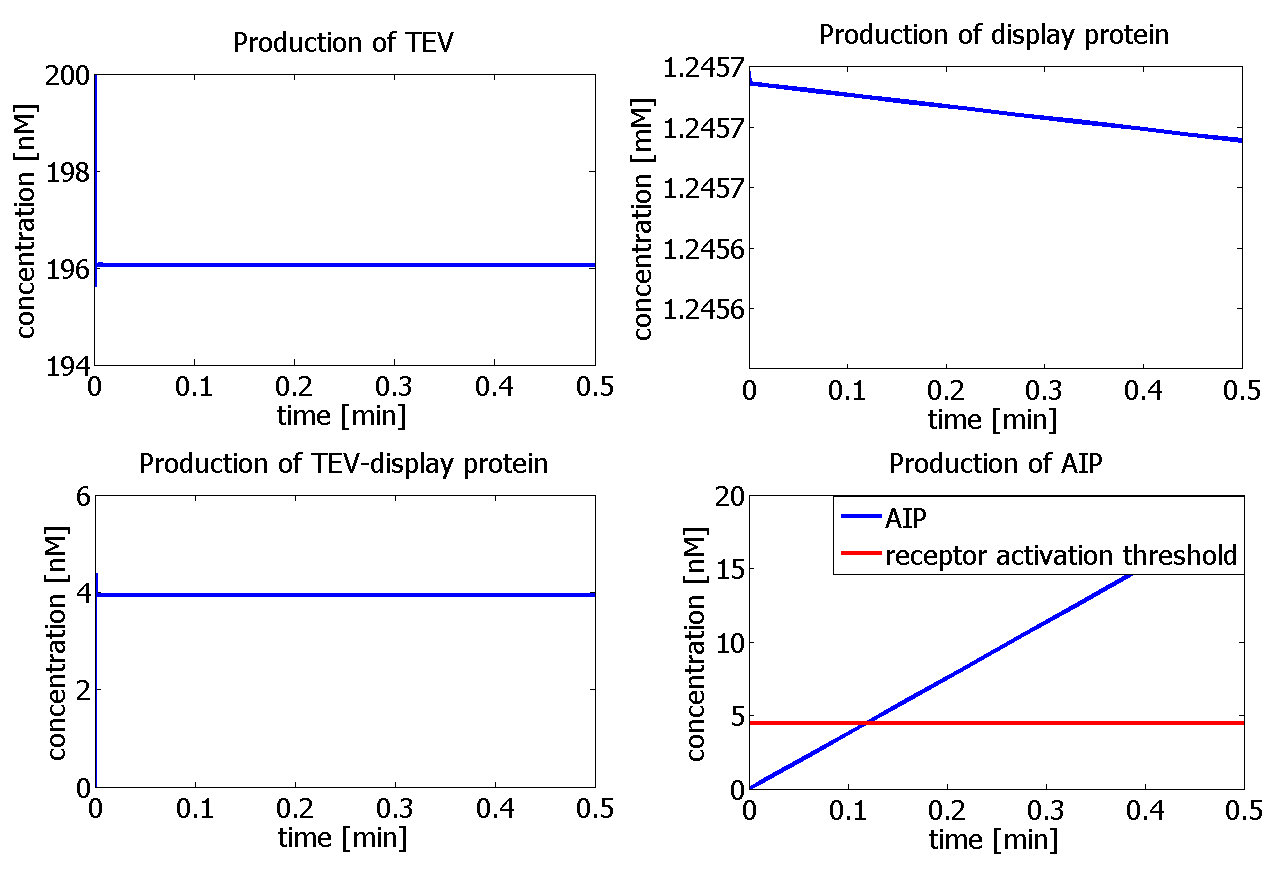
| - | |<html>Graphs showing the simulation using [TEV]<sub>0</sub> = | + | |<html>Graphs showing the simulation using [TEV]<sub>0</sub> = 4×10<sup>-4</sup> mol/dm<sup>3</sup>. The graph on the right hand-side<br/> bottom shows that the AIP threshold (red line) is reached after 22 s.</html> |
|} | |} | ||
</div> | </div> | ||
| Line 23: | Line 23: | ||
<ul> | <ul> | ||
<li>Changing initial concentration of TEV</li> | <li>Changing initial concentration of TEV</li> | ||
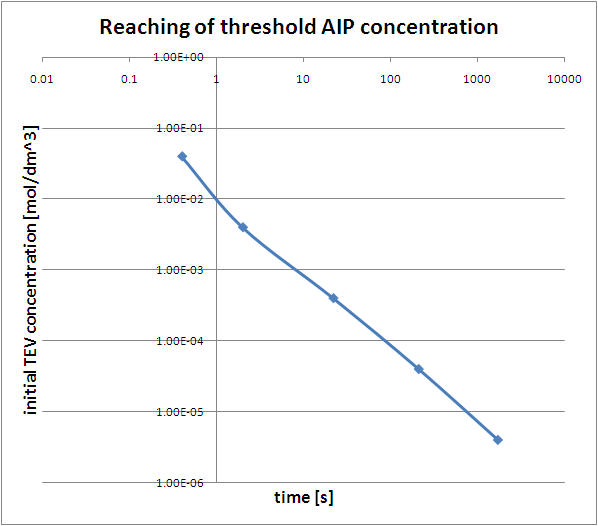
| - | Whether the threshold concentration of AIP is reached is highly dependent on the initial concentration of TEV. The smallest initial concentration of TEV, [TEV>]<sub0</sub>, for which the threshold is reached is 6. | + | Whether the threshold concentration of AIP is reached is highly dependent on the initial concentration of TEV. The smallest initial concentration of TEV, [TEV>]<sub0</sub>, for which the threshold is reached is 6.0×10<sup>-6</sup>mol/dm<sup>3</sup>. On the grap below it can be seen that the optimal [TEV]<sub>0</sub> is a concentration higher than 10<sup>-4</sup>mol/dm<sup>3</sup>, which corresponds to the threshold being reached within 1.5 minutes. |
<br /> | <br /> | ||
</html> | </html> | ||
Revision as of 12:23, 22 October 2010
| Temporary sub-menu: Objectives; Detailed Description; Parameters & Constants; Results & Conclusion;Download MatLab Files; |
| Surface Protein Model | ||||
Risk of False positives It was pointed out that we should assess the risk of false positive activation of the receptor. We are particularly concerned about the display protein not binding to the cell wall, but instead diffusing into the extra-cellular environment. In order to be able to assess the risk of false positives, we need to do further research into the affinity of AIP with attached linker and transmembrane proteins for the receptor as compared to the affinity of the AIP itself for the receptor. This paper [1] might have some information on affinity comparison. We need to know how proteins are being transported from intracellular to transmembrane space. Understanding this concept could give us an idea of what could go wrong. References
|
 "
"


