Output Amplification Model
Goals:
This model was mainly developed in order to determine whether simple production is better than 1-, 2- or 3-step amplification. Furthermore, an estimation of the speed of the response was desirable.
Elements of the system:
- Dioxygenase (blue on the diagrams below) is an enzyme that acts on catechol to produce a yellow output. In most of our models dioxygenase was treated as an output because it was found that active dioxygenase acting on catechol produces the coloured output within a split second.
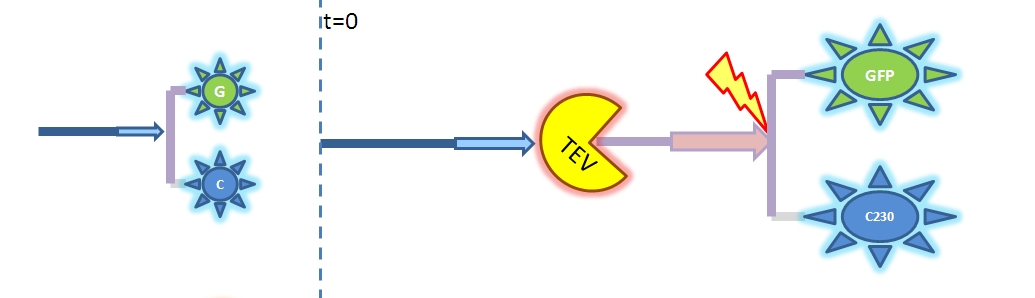
- GFP-Dioxygenase fusion protein (GFP is shown green on the diagrams). Dioxygenase joined by the linker to GFP was assumed to be inactive.
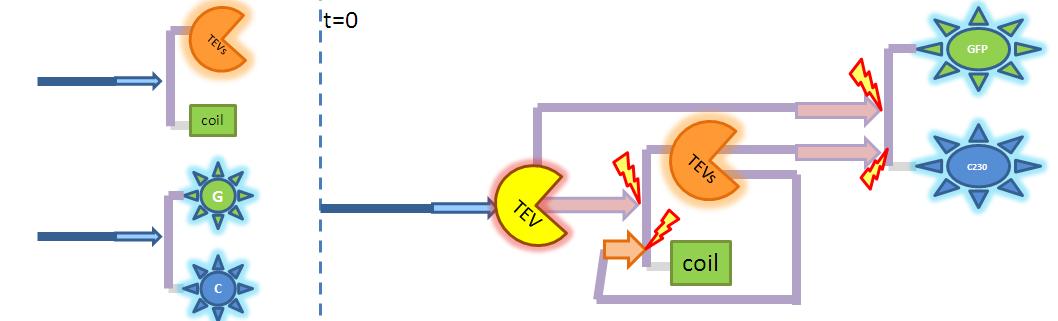
- TEV protease (yellow on the diagrams below) has the ability to cleave the GFP-Dioxygenase fusion protein, hence, it activates dioxygenase
- Split TEV protease (orange on the diagrams below) is an inactive split form of TEV mounted on coiled coils. It can be activated again by coiled coils being cleaved by another active TEV.
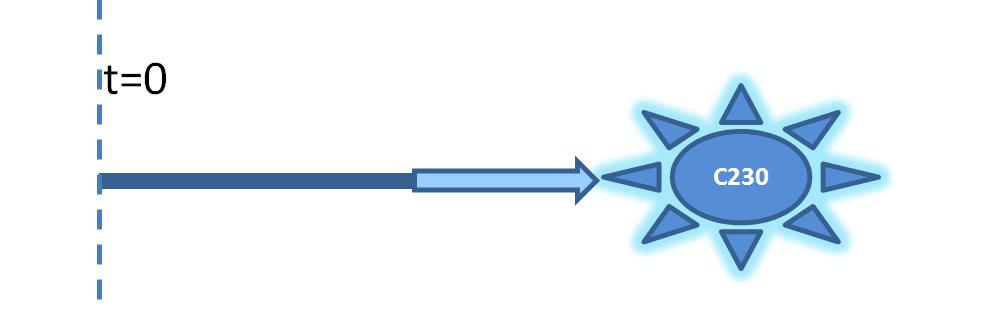
|
| Diagram illustrating simple production of dioxygenase.
|
|
|
| Diagram showing 1-step amplification. TEV enzyme is produced (by simple production) to activate pre-produced inactive dioxygenase.
|
|
|
| Diagram illustrating 2-step amplification. Enzyme activates another enzyme which activates dioxygenase. Both pre-products have the same TEV-site, so simply produced TEV is allowed to act directly on dioxygenase too.
|
|
Major assumptions:
- The chemical and enzymatic reactions are modelled according to the Law of Mass Action.
- Our model assumes that the modelled system is inert within the bacterial body or that reactions with other species within the bacterium is negligible. For example, the TEV protease is not supposed to cleave other molecules due to its specifity.
Surface Protein Model
Goals:
The aim of this model is to determine the concentration of Schistosoma elastase or TEV protease that should be added to the bacteria in order to trigger a response. This would allow us to correlate the required concentration for the activation with the concentration of Schistosoma elastase in the lake.<
It was also attempted to model how long it takes for the protease or elastase to cleave the required amount of peptides.
Elements of the system:
- The surface protein consists of a cell wall binding domain, linker, AIP (Auto Inducing Peptide)
- Schistosoma elastase (this is the enzyme released by the parasite) cleaves AIP from the cell wall binding domain at the linker site. In the laboratory we used TEV protease as we could not obtain the Schistosoma elastase.
- The ComD receptor is activated (i.e. AIP concentration is high enough).
Major assumptions:
- The chemical and enzymatic reactions are modelled according to the Law of Mass Action.
- Our model assumes that the modelled system is inert within the bacterial body or that reactions with other species within bacterium is negligible. For example, the TEV protease is not supposed to cleave other molecules due to its specifity.
- Due to our carefully chosen cell concentrations, the diffusion of free AIPs could be neglected. However, this restricts the model to the considered cell concentrations only.
- The threshold for receptor activation was defined by one specific value as opposed to considering intermediate states between fully "off" and "on".
|
 "
"


