Team:Stockholm/24 September 2010
From 2010.igem.org
Contents |
Andreas
Plasmid prep
From 23/9 ON cultures
Omega E.Z.N.A. Plasmid Miniprep kit I.
- New plasmid prep buffers
| DNA concentration | ||
|---|---|---|
| Sample | Conc [ng/μl] | A260/A280 |
| pSB1A2.RBS.yCCS 3 | 195.5 | 1.81 |
| pSB1A2.RBS.yCCS 4 | 165.7 | 1.85 |
| pEX.N-TAT⋅SOD⋅His 3† | 60.00 | 1.83 |
| pEX.N-TAT⋅SOD⋅His 4† | 90.00 | 1.73 |
| pSB1K3.N-TAT⋅SOD⋅His 4 | 130.5 | 1.84 |
| pSB1K3.N-TAT⋅SOD⋅His 5† | 60.00 | 1.88 |
| pSB1K3.N-Tra10⋅SOD⋅His 5† | 90.00 | 1.93 |
| pSB1K3.N-LMWP⋅SOD⋅His 1 | 258.2 | 1.87 |
| pSB1C3.N-LMWP⋅SOD⋅His 1 | 155.4 | 1.82 |
| pSB1C3.N-LMWP⋅SOD⋅His 4 | 331.9 | 1.80 |
Cloning and assembly
Digestions
[pEX.RFP] = 44.0 ng/μl
| pA.RBS. yCCS (3) X+P | pEX.N-TAT. SH (4) X+P | pK.N-TAT. SH (4) S+P | pK.N-Tra10. SH (5) X+P | pK.N-Tra10. SH (5) S+P | pC.N-LMWP. SH (4) X+P | pC.N-LMWP. SH (4) S+P | pEX.RFP X+P | |
|---|---|---|---|---|---|---|---|---|
| 10X FastDigest buffer | 2 | 2 | 2 | 2 | 2 | 2 | 2 | 3 |
| DNA (1 μg) | 5 | 12.5 | 8 | 12.5 | 12.5 | 4 | 4 | 22 |
| dH2O | 11 | 3.5 | 7 | 3.5 | 3.5 | 12 | 12 | 3 |
| FD XbaI | 1 | 1 | 0 | 1 | 0 | 1 | 0 | 1 |
| FD PstI | 1 | 1 | 1 | 1 | 1 | 1 | 1 | 1 |
| FD SpeI | 0 | 0 | 1 | 0 | 1 | 0 | 1 | 0 |
| 20 μl | 20 μl | 20 μl | 20 μl | 20 μl | 20 μl | 20 μl | 30 μl |
- Incubation: 37 °C, 1 h
Gel verification
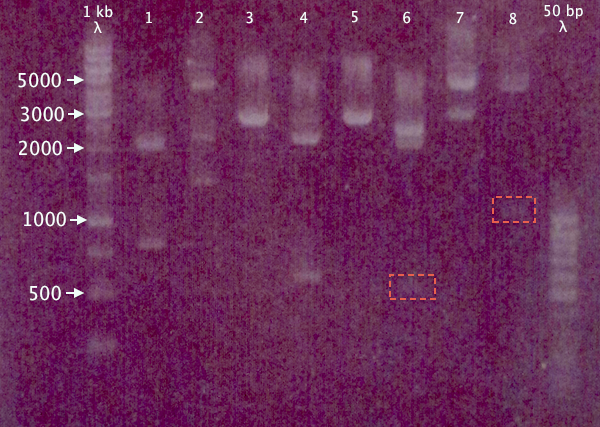
Due to the risk of pSB1A2.RBS.yCCS and pEX.N-TAT⋅SOD⋅His having previously been mixed up, a gel was run on the digested samples (after 15 min incubation) to verify the excised insert size. Remaining samples were also run on the gel to verify digestion.
1 % agarose, 120 V
Expected bands
- pSB1A2.RBS.yCCS X+P: 806 bp, 2061 bp
- pEX.N-TAT⋅SOD⋅His X+P: 558 bp, 4453 bp
- pSB1K3.N-TAT⋅SOD⋅His S+P: ≈2730 bp
- pSB1K3.N-Tra10⋅SOD⋅His X+P: 588 bp, 2188 bp
- pSB1K3.N-Tra10⋅SOD⋅His S+P: ≈2760 bp
- pSB1C3.N-LMWP⋅SOD⋅His X+P: 567 bp, 2054 bp
- pSB1C3.N-LMWP⋅SOD⋅His S+P: ≈2610 bp
- pEX.RFP X+P: 1095 bp, 4453 bp
Results
Seemingly correct bands for samples 1, 3, 4, 5 and 8. More unsure results for 6 and 7, while 2 seems to contain more than one insert, or has been digested at several places.
Nina
Overnight culture
I inoculated protein A#5_TAT, _LMWP & _Tra10 all from colony #1 on each dish.
12 ml LB + 24 ul chloramphenicol.
Concentration measurement
- Protein A#5_CPP_TAT_C cons: 95ng/ul 95/10 = 9.5ng/ul λ260 0.019 λ280 0.009 λ315 -0.002
- Vector with CPP_TAT_C conc: 95 ng/ul
95ng/ul * Volume = 25ng/ul * 5 ul
Volume = 1.3 ul sample and fill up to 5 ml with H2O.
- IgG N+P cons: 30ng/ul 30/2.5 = 12ng/ul λ260 0.007 λ280 0.006 λ315 0.000
- IgG A+E cons: 40ng/ul 40/2.5 = 16ng/ul λ260 0.007 λ280 0.007 λ315 0.001
Ligation
- Vector CPP_TAT_C 1 ul
- Protein A gene 21 ul
- Quick ligase 1 ul
- Quicke ligase buffer 2X 23 ul
- Vector LMWP, TAT & Tra10 0.5 ul each
- gene IgG (N+P) 7.5 ul each
- Quick ligation 1 ul
- Quick ligation buffer 2X 9 ul each
- Vector CPP_TAT_C 1 ul
- gene IgG (A+E) 17 ul
- Quick ligation 1 ul
- Quick ligation buffer 2X 19 ul
Transformation
I transformed the ligations with 10 ul in 100 ul Top 10 cloning cells.
Digestion
- H2O 15 ul
- Fastdigest buffer 10X 2 ul
- DNA 2 ul
- Restriction enzyme NgoMIV 1 ul
- Restriction enzyme PstI 1 ul (Add after 1.5 h incubation in 37 °C and incubate in 30 min)
Inactivate in 80 °C for 30 min.
Added CIAP 1 ul and incubate 1 h in 37 °C.
Johan
Gel purification
A gel was run with pMA (vector with histag) cut before and after his, and bFGF cut before and after
A gel purification was then performed on all samples.
Abs:
bFGF-his: 14 ng/µl his-bFGF: 18 ng/µl pMA before: 22 ng/µl pMA after: 30 ng /µl
Ligation
bFGF after & pMA before
bFGF before & pMA after
5 µl insert
3 µl vector
1 µl T4 ligase
2 µl 10x buffer
9 µl H2O
Transformation
3 µl of all constructs was transformed into top10 cells.
 |

|
 |

|
 |

|

|

|
 "
"


