Team:Kyoto/Modeling
From 2010.igem.org
T.yamamoto (Talk | contribs) (→Stochastic model) |
(→Models) |
||
| Line 3: | Line 3: | ||
===Models=== | ===Models=== | ||
'''Model1: R0011, a lactose promoter''' | '''Model1: R0011, a lactose promoter''' | ||
| - | + | We used R0011, a lactose promoter, to express lysis cassette and to change its expression level. A Mathmatical model for the activity of R0011 is established to characterize lysis cassette with RPU. | |
| - | + | ||
'''Model2: Cell Lysis''' | '''Model2: Cell Lysis''' | ||
| + | We found that lysis cassette cannnot kill cells entirely even if lysis cassette expressed enough. We made some model to explain thin phenommenon. | ||
===Model1: R0011, a lactose promoter=== | ===Model1: R0011, a lactose promoter=== | ||
Revision as of 01:47, 28 October 2010
Contents |
Modeling
Models
Model1: R0011, a lactose promoter
We used R0011, a lactose promoter, to express lysis cassette and to change its expression level. A Mathmatical model for the activity of R0011 is established to characterize lysis cassette with RPU.
Model2: Cell Lysis
We found that lysis cassette cannnot kill cells entirely even if lysis cassette expressed enough. We made some model to explain thin phenommenon.
Model1: R0011, a lactose promoter
Indroduction
It is too laborious to measure the activity of R0011 with all IPTG concentrations, such as 0.01mM, 0.02mM, , , , , 10mM. Measurement with some appropriate IPTG concentrations and making a mathematical model from the experimental data is beneficial to estimate the promoter activity with the other IPTG concentration and to save the trouble.
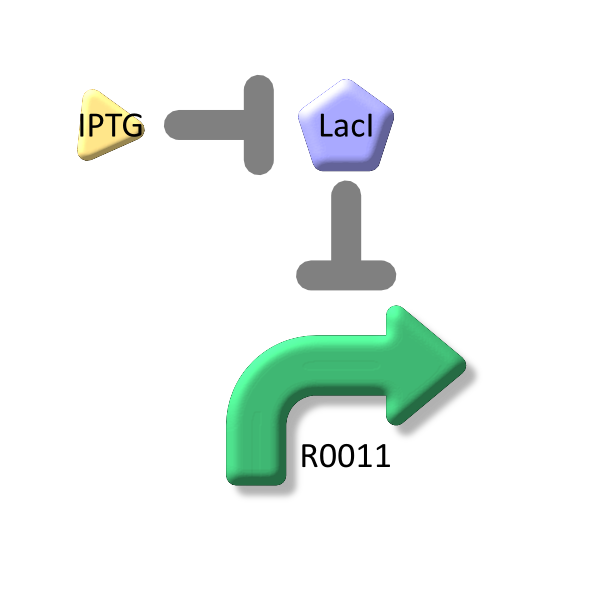
LacI binds to lactose promoter and represses it
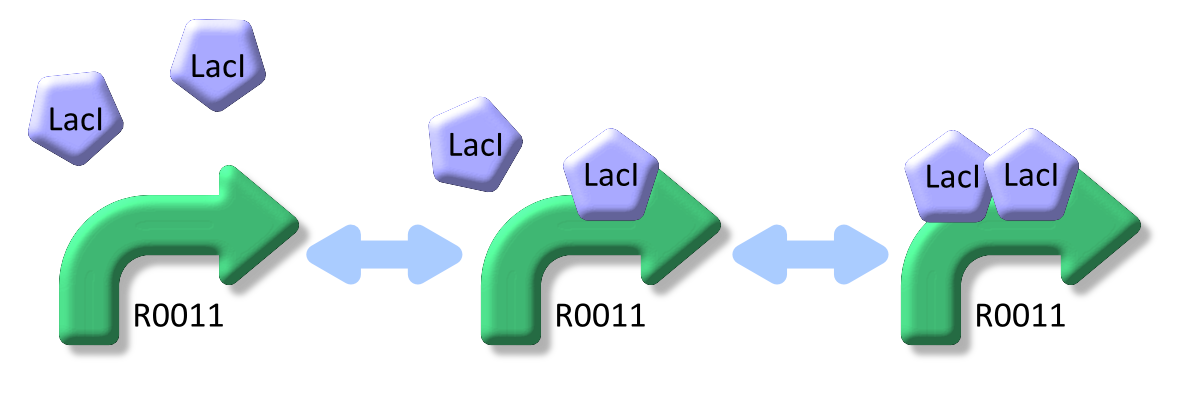
LacI, the repressor of lactose promoter, binds to DNA sequence of lactose promoter and represses it. R0011, a lactose repressor, has two operator regions where LacI binds [1]. The equilibrium reaction of binding and dissociation of LacI and the lactose promoter can be described as equation1.
Here,
- [X] means the concentration of LacI,
- [D] means the concentration of the lactose promoter not binding LacI,
- [DX] means the concentration of the lactose promoter binding a lacI
- [DX2] means the concentration of the lactose promoter binding two LacI.
- K1 means the equilibrium constant for the reaction between [D] and [X],
- K2 means the equilibrium constant for the reaction between [DX] and [X].
- The equilibrium constants K1 and K2 are described as equation2 and equation3 respectively.
From equation2 and equation3, equation4 is established.
Here,
- α is the promoter activity when all the lactose promoter bind to two LacIs respectively,
- β is the promoter activity when all the lactose promoter bind to a LacI respectively,
-
 is the ratio of [D] to the total concentration of lactose promoter,
-
 is the ratio of [DX] to the total concentration of lactose promoter.
In this model, we hypothesized that the promoter activity is 0 when all the lactose promoter bind two LacI respectively.
LacI binds to lactose promoter and represses it
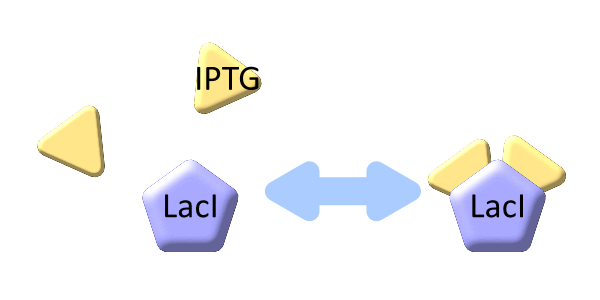
The inducer of lactose promoter, Lactose and IPTG, binds to LacI, and changes LacI conformation so that LacI dissociates from lactose promoter. The equilibrium reaction of the inducer and LacI is described as follows.
Here,
- [SX] is the inducer concentration,
- [X] is the concentration of LacI not binding with the inducer,
- n is the number of the inducer molecule binds to one LacI molecule.
The equbilium constant, KXn, is described as equation6.
We assume that the total concentration of LacI in a cell does not change in the log phase growth in which the cell growth does not change because the dilution effect for LacI due to the cell growth does not change and the expression and the degradation of LacI is constitutive. Therefore, let XT as the concentration of total LacI, and equation7 is applied.
From equation6 and equation7, equation8 is established [2].
Lactose and IPTG are inducer of lactose promoter
From equation4 and equation8, the relationship between IPTG and lactose promoter activity is described as follows.
Simulation
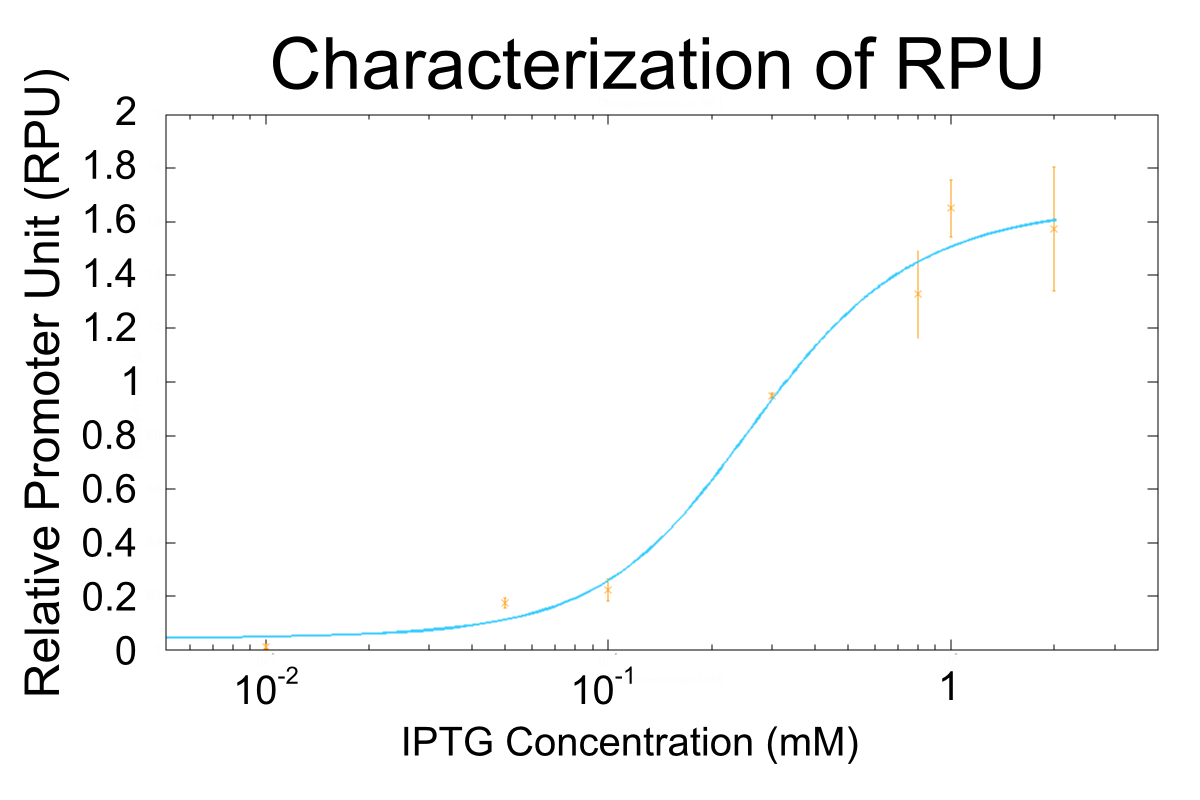
We apply equation9 to the result of characterization of R0011 and parameters are decided by using MATLAB 7.10.0 (MathWorks).
The orange markers and error bars are experimental data and blue line is the expectation from this model. The data of 0.5mM IPTG does not be used in fitting the model.
Parameters are shown in table below.
| symbol | description | value | unit | note |
|---|---|---|---|---|
| α | the transcription constant for [D] | 1.667 | RPU | calculated from the experimental result |
| β | the transcription constant for [DX] | 0.0000149 | RPU | calculated from the experimental result |
| K1 | the equilibrium constant for between [D] and [X] | 1.607 | mM | calculated from the experimental result |
| K2 | the equilibrium constant for between [DX] and [X] | 0.339 | mM | calculated from the experimental result |
| XT | total concentration of lacI | 5.131 | mM | calculated from the experimental result |
| KX | the equilibrium constant for between [SX] and [X] | 0.05321 | mM | calculated from the experimental result |
| n | the number of IPTG molecules binding to a lacI | 1.285 | - | calculated from the experimental result |
Reference
- http://partsregistry.org/Part:BBa_R0011
- Uri Alon (2006) “An Introduction toSystems Biology” Chapman & Hall
Model2: Cell Lysis
Unexpected result of lysis cassette
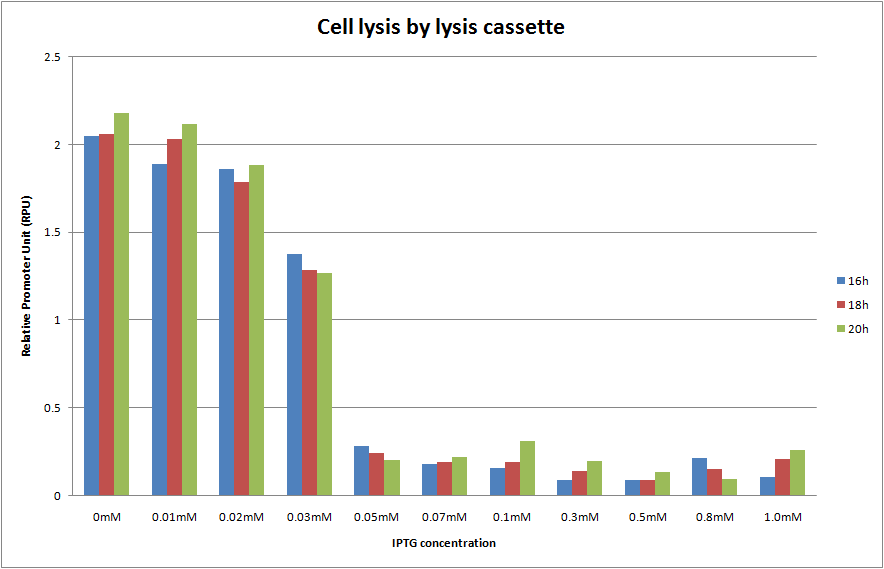
We cultivated E.coli transformed with the construction, Plac and lysis cassette on the low copy plasmid, at various IPTG concentrations and A550 was measured at 16h, 18h and 20h. The result is shown below.
We predicted two things. One is that A550 is measured as the steady state at 16h, 18h and 20h. The other is the more IPTG is introduced, the more A550 in the steady state decreases and completely reached zero. In the result, as you see Fig.1, OD550 was measured as the steady state at 16h, 18h and 20h in every IPTG concentration. In addition, we observed that OD550 decreased in the range from 0mM to 0.05mM of IPTG concentration. However, OD550 observed was a fixed value, about 0.3 of OD550, in the range from 0.05mM to 1.0mM of IPTG concentration against our prediction. And E.coli was not completely killed by holin in IPTG 1.0mM as the too high concentration!
You may consider that this result occurred because of the mutation of our biobrick part. However, we denied the hypothesis by proposing the model the mutation happens in the next section.
Mutation model
In this section, we explain the mutation model. We assume that our part works correctly in the beginning, accumulates the mutations on the way and loses its original function. As the result, OD550 does not reach zero even in IPTG 1.0 mM which is high enough. If this result really occurred by the mutant factor, OD550 at 16h, 18h and 20h must increase like an exponential function. However, in our result, OD550 at 16h, 18h and 20h in every IPTG concentration are measured as the steady state. Therefore the mutation model is not suited. Then, we will propose several stochastic models below.
Stochastic model
We propose four stochastic models.
1. First model is that the effect of endolysin for cell lysis is limited though the concentration of endolysin increases. We consider that when much endolysin is expressed, the size of holes made by holin restricts the transition rate of endolysin from cytosol to periplasm, where endolysin degrades peptidoglycan and makes cell lysis.
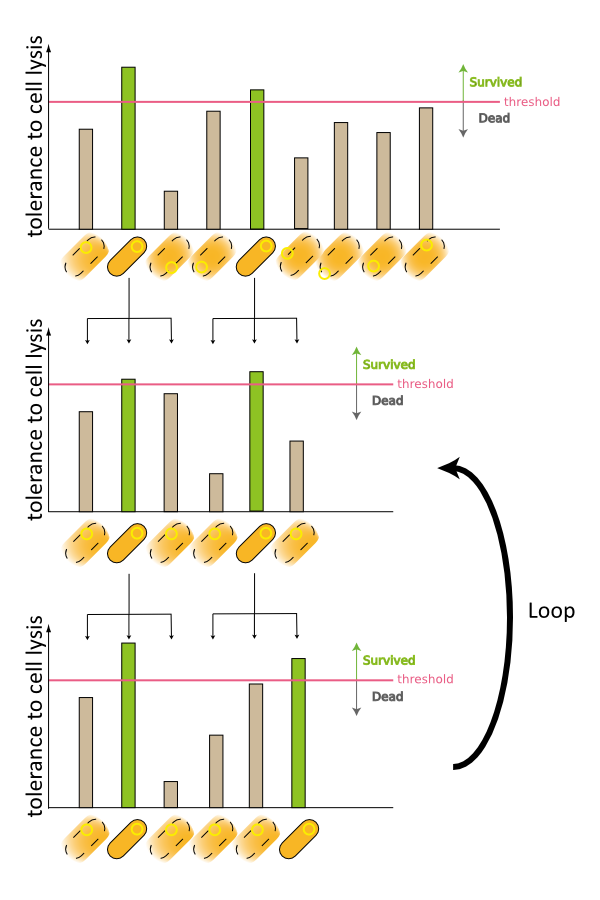
2. Second model is that the expression of holin and endolysin is not enough to kill every cell entirely. In this model, we assume that some cells are weak to the cell lysis and other cells are tough to that. If this is true, some proportional cells survive and the other proportional cells are died constantly (Fig.2).
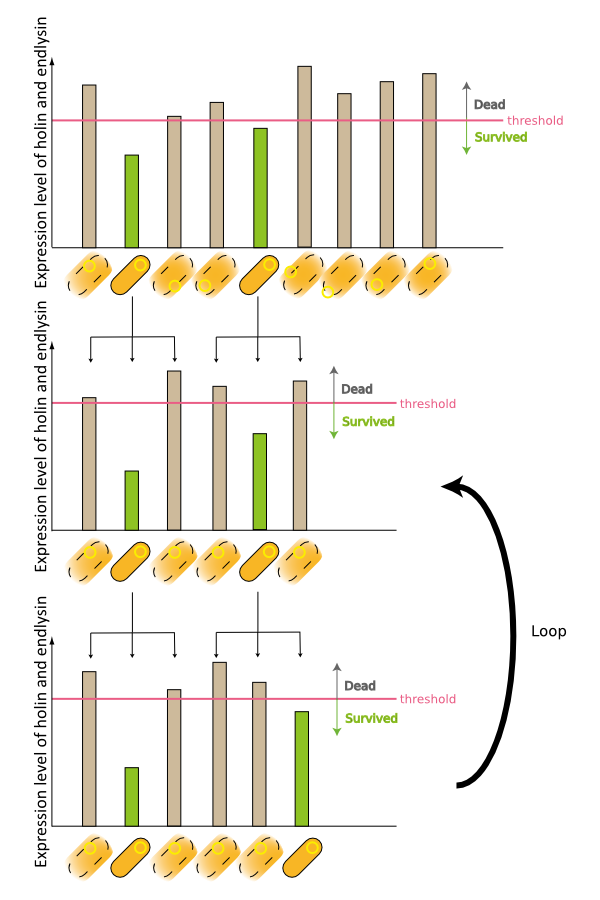
3. Third model is that quantity of expressed holin and endolysin is different from cells respectively. We assume that every cell has the threshold of lysis. In any concentration of IPTG, some proportional cells survive and the other cells are killed because of the difference of expression. (Fig.3)
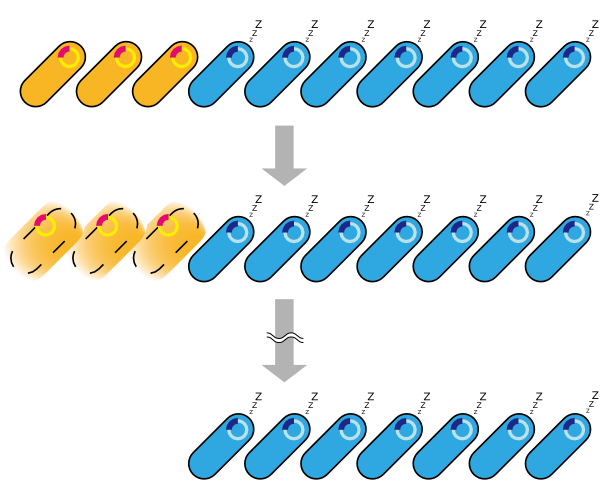
4. Fourth model is that the transcription of holin and endolysin decreases because a part of the population of cells comes to be dormancy state [1] [2]. In any concentration of IPTG, a part of population of cells is always dormancy state and survive.
In the conclusion, it is not mutant but stochastic factor that brought this result. In addition, every four stochastic models can explain that OD550 was measured as the steady state at 16h, 18h and 20h and did not reach zero in every IPTG concentration.
Reference
- R Jayaraman. “Bacterial persistence: some new insights into an old phenomenon” J.Biosci.33(5),December 2008,795-805,
- Slava S.Epstein. “Microbial awakenings A theory of how microbes 'wake up' from dormancy could help to solve scientific mysteries and improve disease control” NATURE|Vol 457|26 February 2009
 "
"


