 "
"
Team:Valencia/WB
From 2010.igem.org
Alejovigno (Talk | contribs) |
Alejovigno (Talk | contribs) |
||
| Line 2: | Line 2: | ||
<div id="HomeCenter"> | <div id="HomeCenter"> | ||
| - | + | {{Team:Valencia/to_tech}} | |
<div id="Titulos"> | <div id="Titulos"> | ||
Microbial Albedo Recorder | Microbial Albedo Recorder | ||
Revision as of 08:26, 26 October 2010
Time goes by...
(El tiempo pasa...)
Follow us:

Our main sponsors:

Our institutions:

Visitor location:
» Home » The Project » Creating Technologies
Microbial Albedo Recorder
Introduction
In order to study the capability of the cultures to absorb energy coming from sunlight depending on their coloring, we are going to measure the temperature that the cultures reach compared with others control know-color cultures. These temperatures are measured by a system of thermocouples.

For this objective, it has been designed a dish in which our E. Coli and yeast cultures are studied. There are as well two reference cultures: one entirely black and another totally white. The cultures are exposed to radiation coming from sunlight. All cultures are previously kept in constant and known temperature.
In order to make sure that the temperature differences among the cultures are due only to albedo effect, two strategies have been designed.
- Several light sensors have been laid out symmetrically. The signal received by these sensors is transmitted to an electronic circuit which produces an electric response that finally ends up in the datalogger
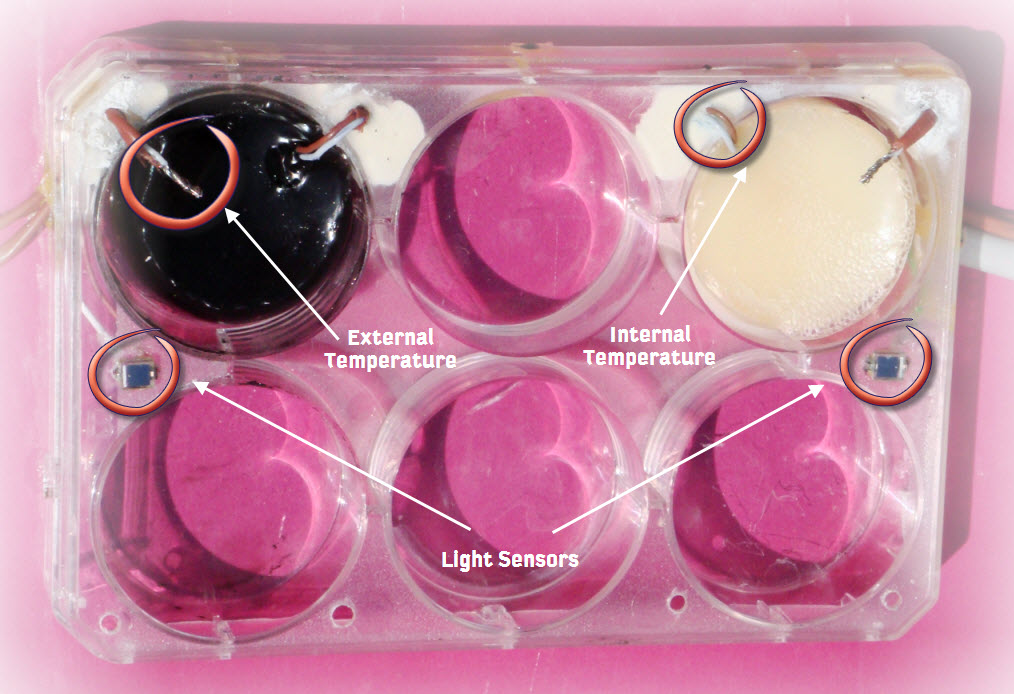 Layout of the thermocuples and light sensors.
- Several thermocouples are arranged surrounding the cultures to make sure that the external temperatures are equal for all of them. We used our temperature mesurement system in order to accomplish this task.

Therefore, any temperature difference between the cultures has to be produced by the capability of absorbing light. This temperature is then measured by another thermocouple inserted into the culture. Furthermore, all this data is recorded and shown in real time through a computer screen.
Mesurement System
The aim of this part of the project is to quantify the difference of albedo depending on the color of several cultures of microorganisms.
In order do this, we need to measure two types of magnitudes: the amount of solar radiation that reaches the cultures (illuminance) and internal and surrounding temperatures of the cultures. This is because we propose that if the surrounding temperature of the cultures and the incident solar radiation are the same for all the cultures, then our Microbial Albedo Recorder system can estimate the albedo difference between those cultures, because the difference in the internal temperatures will be due only to the albedo effect.
Light sensor
With this electronic circuit we aim to adecuate the signal coming from the light sensors (photodiodes). This will make the signal useful to real time adquisition and ionterpretation.
A photodiode can behave in tho very diferent ways, depending on the conection configuration: photoconductive or photovoltaic mode. We are interested in the first one, because it make posible a precise and stable relationship between the energy of the incident radiation and the output current.
The following figure shows the equivalent circuit used in the simulations and the caracteristic curve


Ice bath thermocouple compensation
Our temperature measurement system is based on the Seebeck effect. The Seebeck effect happens when a junction of two different metals is exposed to a certain temperature. In the loose ends of the wires appears a difference of voltage proportional to the that temperature. Measuring the generated voltage is possible to determine the temperature which generated de effect. This is done by means of polynomial interpolation (compatible with the ITS-90 standard).

In order to use this system is necessary to connect it to a electronic acquisition system. In the new
connection places appear new thermocouple junctions (J1 and J2 in Figure 1) which modify the original
voltage difference with the following expresion:
Vmeasured = Vreal(Tj) + Verror(Tj1) + Verror(Tj2)
The are several strategies to deal with this problem.
The electronic acquisition system that we use is the Datalogger 34970A (Agilent). This device has the possibility to deal the already mentioned problem with two different strategies.
- Automatic compensation
- Fixed compensation
Automatic Compensation

The automatic compensation is made internally by the device, measuring the surrounding temperature of the copper junctions, with solid state sensors. This is a very simple option, but its precision is very low, and inadequate for our purpose.
Fixed Compensation
The fixed compensation however requires the introduction of another subsystem: an ice bath. Inside this bath, the coper wire/thermocouple confection is made. So, this is a known and fixed junction, which its temperature is introduced to the datalogger during the setup.

This methods is a very precise however it has a huge inconvenient: the temperature of the bath has to be CONSTANT. In order to ensure this though the hole experiment duration, we used a sufficiently big ice mass. Also we added a drain, to expel the liquid water.
Experimental assay
In our particular case, we selected a J type thermocouple (Copper-Constantan), because one of its metals is copper already, and then there is only one extra junction in the connection.

Here we have:
Vmeasured = Vreal(Tj) + Verror(Tj2)
Then the practical implementation will also be easier with the
selected configuration.
A simple experiment was carried out with both automatic and fixed compensation: the measure of the temperature of the ice.

In Figures 6, the obtained results are shown and is possible to
see the error of the automatic compensation and how is worth to
make an extra effort in the practical implementation.

</div>