Team:TU Delft/project/rbs characterization
From 2010.igem.org
(→RBS Characterization) |
(→RBS Characterization) |
||
| Line 40: | Line 40: | ||
|} | |} | ||
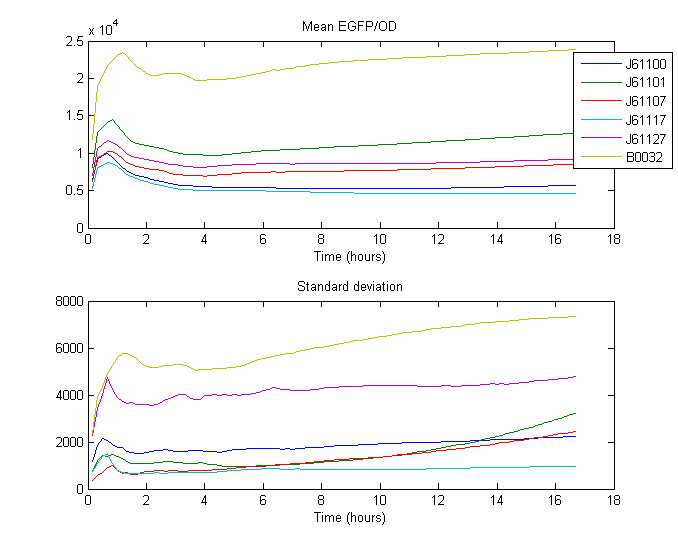
| - | <html><div style='clear:both'> The cells were cultured over 18 hours in 96-well plates using a Gen5 fluorescence and absorbance plate reader, LB with ampicillin was the culture medium used in these experiments. | + | <html><div style='clear:both'> The cells were cultured over 18 hours in 96-well plates using a Gen5 fluorescence and absorbance plate reader, LB with ampicillin was the culture medium used in these experiments. Only the results obtained during exponential growth face were taken into account. |
</div> | </div> | ||
</html> | </html> | ||
| + | |||
| + | |||
| + | [[Image:26_07_2010_Rbs.png|center]] | ||
| + | |'''Note:''' Fluorescence is reported as Arbitrary Fluorescence Units. | ||
| + | |||
| + | <html><div style='clear:both'> | ||
| + | The RBS strength was calculated by taking the mean of the ratio between the expression of the standard RBS ([http://partsregistry.org/Part:BBa_B0032 B0032]) and expression of Anderson RBS over time. The Expression is defined as the quotient of the measured fluorescence divided by measured biomass (OD at 600nm). | ||
| + | </div> | ||
| + | </html> | ||
| + | |||
{| style="color:black; background-color:white;" cellpadding="5" cellspacing="0" border="1" align="left" | {| style="color:black; background-color:white;" cellpadding="5" cellspacing="0" border="1" align="left" | ||
| Line 65: | Line 75: | ||
|[http://partsregistry.org/Part:BBa_B0032 B0032] | |[http://partsregistry.org/Part:BBa_B0032 B0032] | ||
|0.300000 | |0.300000 | ||
| - | |||
|} | |} | ||
| - | + | The result of this experimental set up was a simple characterization of five of the Anderson RBS sequences in relation to other standard well-characterized RBS. The given relative strengths are displayed assuming [http://partsregistry.org/Part:BBa_B0034 B0034] as the unit. | |
| - | + | ||
| - | The | + | |
| - | + | ||
| - | + | ||
| - | + | ||
| - | + | ||
| - | We've also | + | We've also trying to look at mRNA folded shapes using mfold to see if there was a common pattern in the Anderson RBS shapes. This might have been usable in predicting RBS strength for the other untested Anderson RBS sequences. Unfortunately, this didn't seem to be the case, as all the tried RBS sequences had very different mfold shapes. |
Revision as of 14:24, 10 August 2010
RBS Characterization
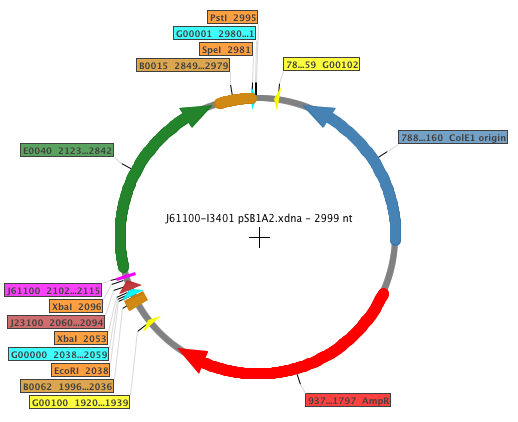
For our RBS characterization project, five different RBS sequences from the [http://partsregistry.org/Ribosome_Binding_Sites/Prokaryotic/Constitutive/Anderson Anderson RBS family] (J61100, J61101, J61107, J61117, J61127) and the standard RBS [http://partsregistry.org/Part:BBa_B0032 B0032] were placed in front of the standard [http://partsregistry.org/Part:BBa_E0040 GFP coding sequence]. The Biobricks generated in order to perform the experiments were: [http://partsregistry.org/Part:BBa_K398500 K398500], [http://partsregistry.org/Part:BBa_K398501 K398501], [http://partsregistry.org/Part:BBa_K398502 K398502], [http://partsregistry.org/Part:BBa_K398503 K398503], [http://partsregistry.org/Part:BBa_K398504 K398504]. The general map of the construction is shown below, where the RBS is displayed in fucsia.
| Feature | Function |
| [http://partsregistry.org/Part:BBa_B0032 AmpR] | Ampicillin resistance |
| [http://partsregistry.org/Part:BBa_B0015 B0015] | Transcriptional (double) terminator |
| [http://partsregistry.org/Part:BBa_B0062 B0062] | Transcriptional terminator |
| [http://partsregistry.org/Part:BBa_E0040 E0040] | GFP |
| [http://partsregistry.org/Part:BBa_G00000 G00000] | Standard prefix |
| [http://partsregistry.org/Part:BBa_G00001 G00001] | Standard suffix |
| [http://partsregistry.org/Part:BBa_G00100 G00100] | VF2 primer binding site |
| [http://partsregistry.org/Part:BBa_G00101 G00101] | VR primer binding site |
| [http://partsregistry.org/Part:BBa_J61100 J61100] | RBS Anderson family |
| [http://partsregistry.org/Part:BBa_J23100 J23100] | Promoter |
|Note: Fluorescence is reported as Arbitrary Fluorescence Units.
| RBS | Strength |
| [http://partsregistry.org/Part:BBa_J61100 J61100] | 0.047513 |
| [http://partsregistry.org/Part:BBa_J61101 J61101] | 0.119831 |
| [http://partsregistry.org/Part:BBa_J61107 J61107] | 0.065454 |
| [http://partsregistry.org/Part:BBa_J61117 J61117] | 0.038518 |
| [http://partsregistry.org/Part:BBa_J61127 J61127] | 0.087334 |
| [http://partsregistry.org/Part:BBa_B0032 B0032] | 0.300000 |
The result of this experimental set up was a simple characterization of five of the Anderson RBS sequences in relation to other standard well-characterized RBS. The given relative strengths are displayed assuming [http://partsregistry.org/Part:BBa_B0034 B0034] as the unit.
We've also trying to look at mRNA folded shapes using mfold to see if there was a common pattern in the Anderson RBS shapes. This might have been usable in predicting RBS strength for the other untested Anderson RBS sequences. Unfortunately, this didn't seem to be the case, as all the tried RBS sequences had very different mfold shapes.
 "
"

