Team:Kyoto/Project/Goal A
From 2010.igem.org
Contents |
Goal A: Characterization of R0011, a strong lactose promoter
Introduction
We used <partinfo>R0011</partinfo> [learn more], a lactose promoter, for the Lysisbox.
Because part parameters of R0011 are partially unclear [1], we measured the promoter activity of the R0011 at various concentrations of IPTG in order to determine the relationship between the activity of lysis cassette and the expression levels of its promoter.
We characterize R0011 by Relative Promoter Unit (RPU) [learn more], because absolute promoter activity depends on test conditions and measurement instruments. RPU can reduce this Coefficient of Variation (CV) from 39.1% to 17.5% [2]. Therefore RPU can make it easier for us to share the data of promoter activity and use BioBricks.
Method
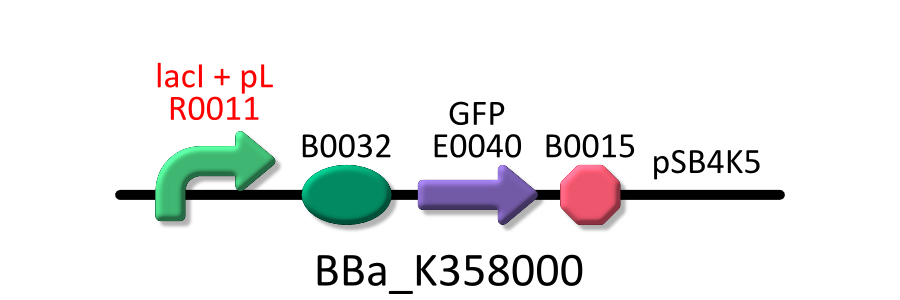
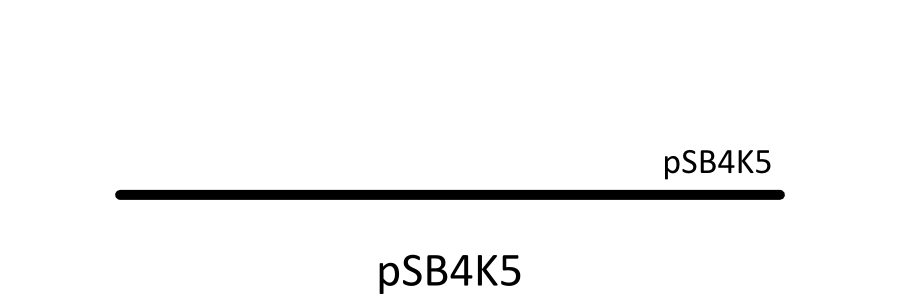
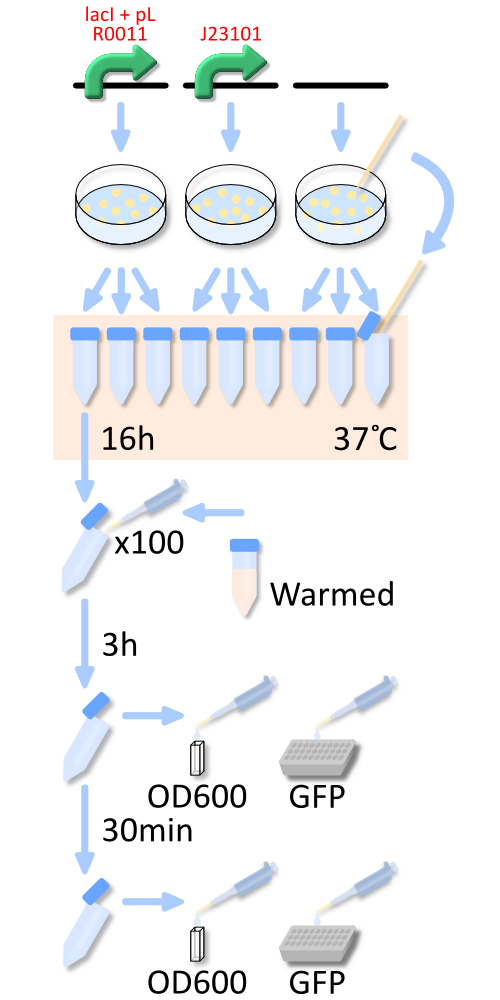
In order to measure RPU of R0011, E. coli host, KRX was transformed with <partinfo>BBa_K358000</partinfo> (R0011 lac promoter), <partinfo>BBa_K358001</partinfo> (standard promoter), or pSB4K5 (mock). The reason why we used KRX is that lacI repressor is overly expressed in KRX and lacI can repress lactose promoter fully at even low IPTG concentration [3].
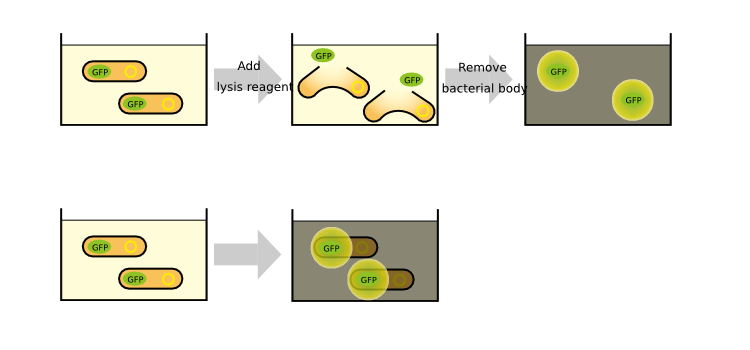
In order to measure RPU, we must use two types of E.coli transformed with the test promoter circuit and the standard promoter circuit respectively to compare absolute activity of the test promoter with that of the standard. BBa_K358000 has the lactose promoter (R0011) immediately upstream of GFP, and BBa_K358001 has the standard promoter (J23101). We constructed both parts with a low copy number plasmid, pSB4K5, because lacI cannot repress lactose promoter completely even in the absence of IPTG if a high copy number plasmid is used. The E.coli transformed with pSB4K5 was also used for correcting the autofluorescence signal. We picked up three colonies from each plate, and cultivated them in M9 medium supplemented with 50 µg/mL of kanamycine at 37x2103; for about 16h. The precultures were diluted to 1:100 in pre-warmed fresh M9 medium supplemented with 50 µg/mL of kanamycine and incubated with shake at 37℃. After 3h or 3.5h, we measured OD600 followed by GFP fluorescence of the culture. We measured the GFP fluorescence of some samples after cell was lysed by the cell lysis reagent and collected the supernatant which contains GFP protein. Unfortunately, we run short of the lysis reagent, the other samples are measured without using it.
The measurement of GFP fluorescence after cell lysed by the cell lysis reagent is illustrated in the figure above, and the measurement of GFP fluorescence without cell lysis is illustrated in the figure below.
To know more detailed procedures, go Protocols.
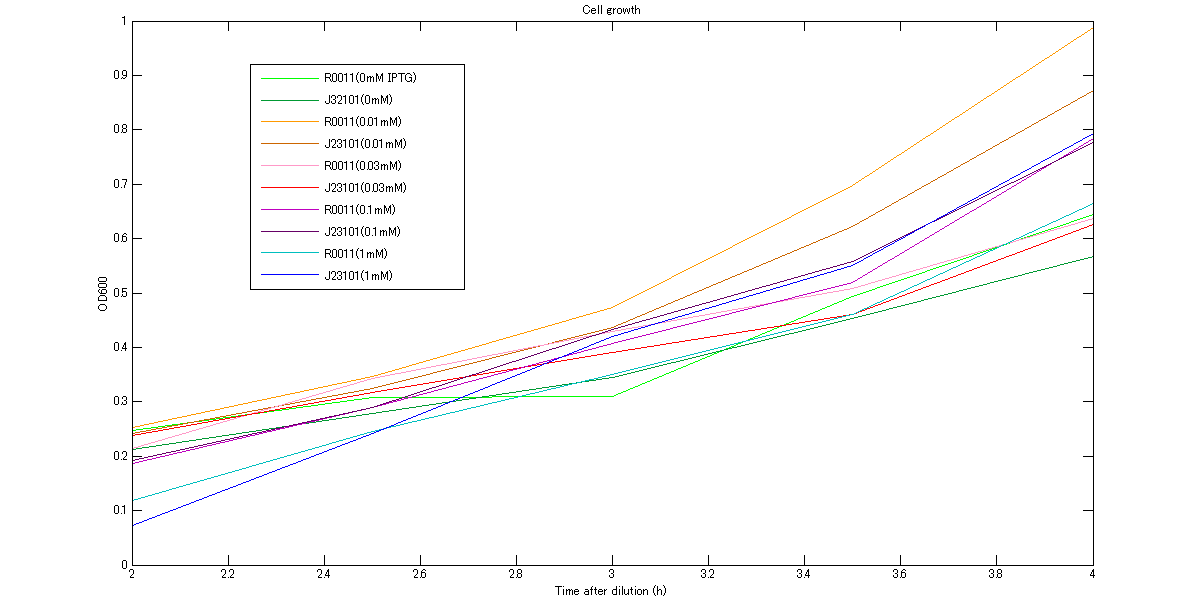
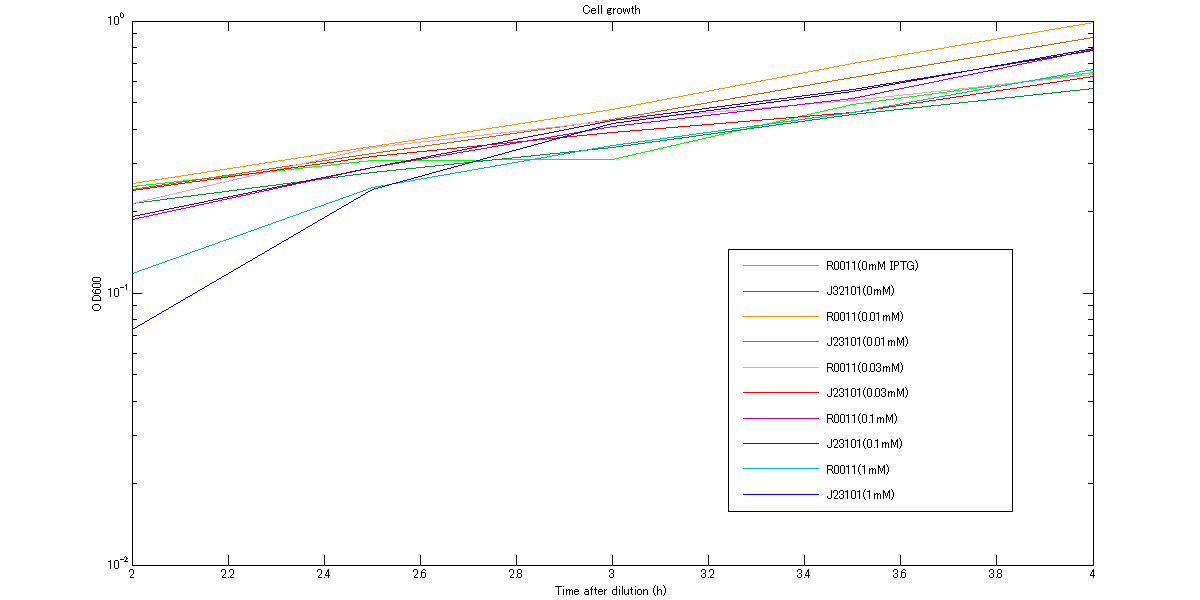
We measured OD600 every 30 minutes after dilution to ensure that cells are in log phase growth.
RPU is calculated as follows.
We also use these rough calculations;
Here, F3h and F3.5h are the GFP fluorescence measured at 3h and 3.5h, respectively,
ABS3h and ABS3.5h are OD600 of the culture at 3h and 3.5h, respectively.
From the experimental data of cell growth from 2h to 4h after dilution, we assumed cell growth from 3h to 3.5h after dilution can be approximated as linear. Thus, the mean ABS can be calculated as described in (3). If GFP concentration in cell is in steady states, the increase of GFP fluorescence depends only on cell growth. We used the first approximation based on these assumptions to calculate RPU.
Measurement of lactose concentration is done by using Lactose Assay Kit (BioVison) [4].
Result
At first, we measured cell growth from 2h to 4h to confirm our assumption that cells are in log phase growth when we measure RPU. The growth curves are shown in figures below. These graphs indicate that cells were in log phase growth and cell growth from 3h to 3.5h after dilution can be approximated as linear.
Thus, we calculated RPUs by using equation 1 approximated with 2 and 3. The determined RPUs are shown in table1.
| IPTG (mM) | RPU | |||||
|---|---|---|---|---|---|---|
| A | B | C | Average | s.d. | CV | |
| 0 | * | 0.0122 | 0.0147 | 0.0134 | 0.00821 | 0.611 |
| 0.01 | 0.0191 | 0.00963 | 0.00244 | 0.0104 | 0.0084 | 0.806 |
| 0.03 | 0.177 | 0.155 | 0.198 | 0.174 | 0.0173 | 0.0997 |
| 0.1 | 0.205 | 0.191 | 0.269 | 0.221 | 0.0416 | 0.188 |
| 0.3 | 0.938 | 0.955 | 0.955 | 0.949 | 0.00981 | 0.0103 |
| 0.8 | 1.44 | * | 1.21 | 1.37 | 0.161 | 0.122 |
| 1.0 | 1.60 | 1.58 | 1.65 | 1.65 | 0.106 | 0.0640 |
| 2.0 | 1.49 | 1.83 | 1.39 | 1.57 | 0.233 | 0.148 |
- *One of RPU in IPTG 0mM couldn’t be measured. One of RPU in IPTG 0.8mM couldn't also be measured.
- *In this table, RPU in 0, 0.01, 0.1, 1.0 mM IPTG is measured after cell lysed by the cell lysis reagent and RPU in 0.05, 0.3, 0.8, 2.0 mM IPTG is measured without cell lysis.
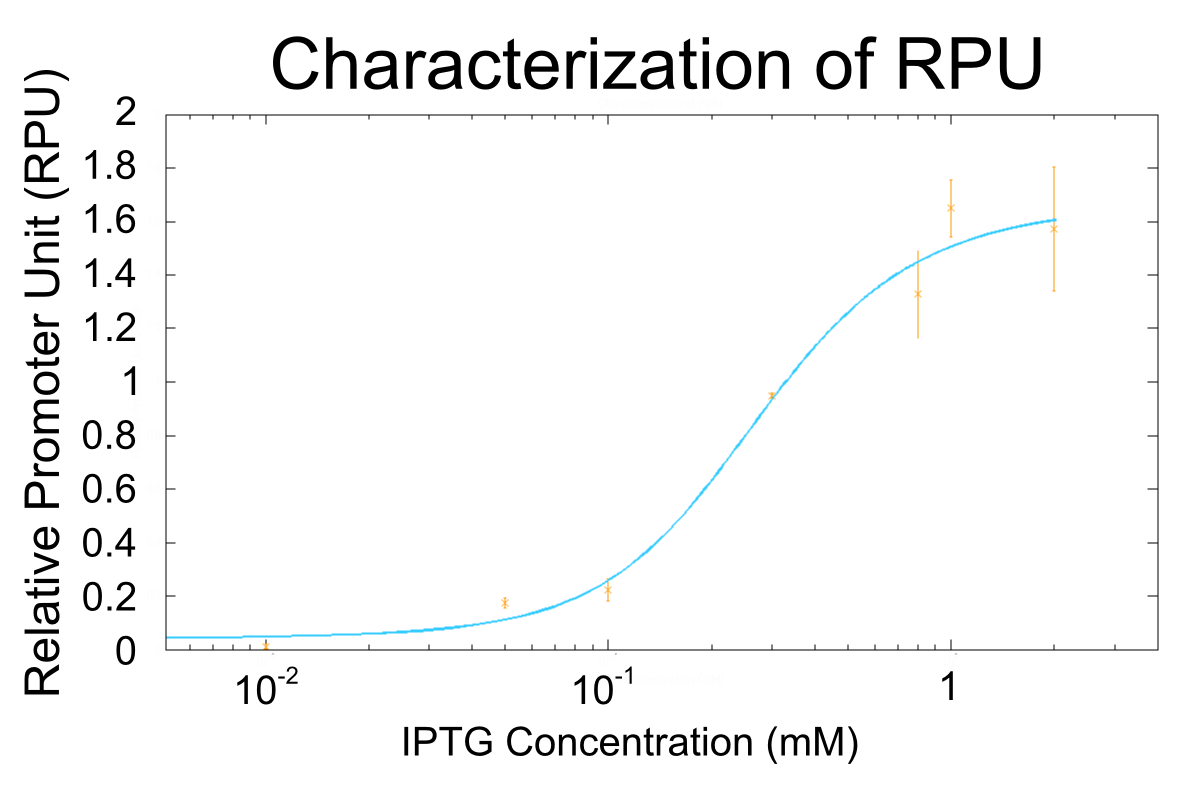
We made the model about the activity of R0011 and determined parameters from the result to estimate RPU of R0011 at IPTG concentrations we couldn’t measure. The result is shown in Fig.3.
To know more about this model, go Modelling.
Discussion
The result indicates that the maximum activity of R0011 is about 1.6 RPU and the minimum is less than 0.01 RPU and that R0011 has wide range of activity (the maximum activity of R0011 is at least about 160 fold greater than the minimum activity at least). The maximum activity of R0011, 1.6 RPU agrees with the previous data [5]. The wide range of RPU can change the effect of lysis cassette variously, and it is useful to characterize lysis cassette.
The graph of cell growth indicates that cells are in log phase growth at 3h and 3.5h after dilution. This means that time we measured RPU was correct. In this characterization, there is two way to measure GFP fluorescence. One is to measure GFP fluorescence after cells are lysed by cell lysis reagent and the other is to measure GFP fluorescence without cell lysis. We think both measurements are valid because RPU of R0011 with 1mM IPTG measured with cell lysis corresponds to the previous data [5] and the way of measurement of RPU without cell lysed is recommended one by a previous igem team [6].
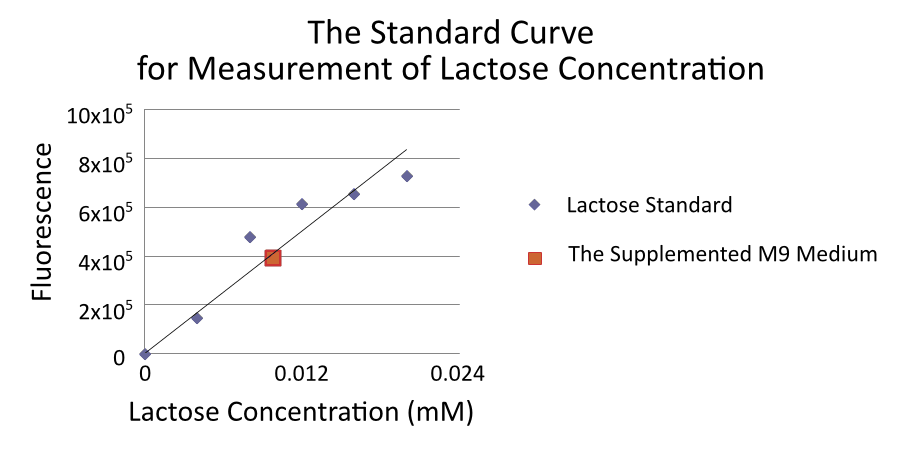
By the way, we found that supplemented M9 medium was contaminated by approximately 0.01mM lactose.
We thought that lactose in the supplemented M9 medium comes from casamino acids because casamino acids is made from milk which contains lactose. Therefore, we tried to culture E.coli and measure RPU without the casamino acids because lactose in the supplemented M9 medium can induce R0011. However, without casamino acids, the growth rate of E.coli declined and we could not measure RPU. All RPU data was measured with casamino acids. Accordingly, the real value for RPU of R0011 at low IPTG concentration may be lower than the value gained from this experiment. CV in 0mM IPTG is so high, 0.611, and CV in 0.01mM IPTG is also high, 0.806. We cannot trust RPU in 0mM and 0.01mM ITPG so much.
Finally, we could characterize R0011 at high IPTG concentration correctly. However, characterization of R0011 at low IPTG concentration may be required additional measurements.
Reference
- http://partsregistry.org/Part:BBa_R0011
- Jason R Kelly et al. ”Measuring the activity of BioBrick promoters using an in vivo reference standard.” Journal of Biological Engineering 2009, 3:4
- http://www.promega.com/pnotes/94/14410_27/14410_27.pdf
- http://www.biovision.com/manuals/K624-100.pdf
- http://partsregistry.org/Part:BBa_R0011:Experience
- https://2009.igem.org/Team:UNIPV-Pavia/Methods_Materials/Fluorescence#Fluorescence_and_water_dispensation
 "
"


