From 2010.igem.org
Microscope
Experimental setup
A fluorescence microscope with motorized x, y and z control, a motorized shutter and a 60× lens is used with appropriate fluorescence filters for the fluorescence signals. Light-emitting diode arrays are installed as light sources for red light (660 nm) and far-red light (748 nm) pulses.
Control
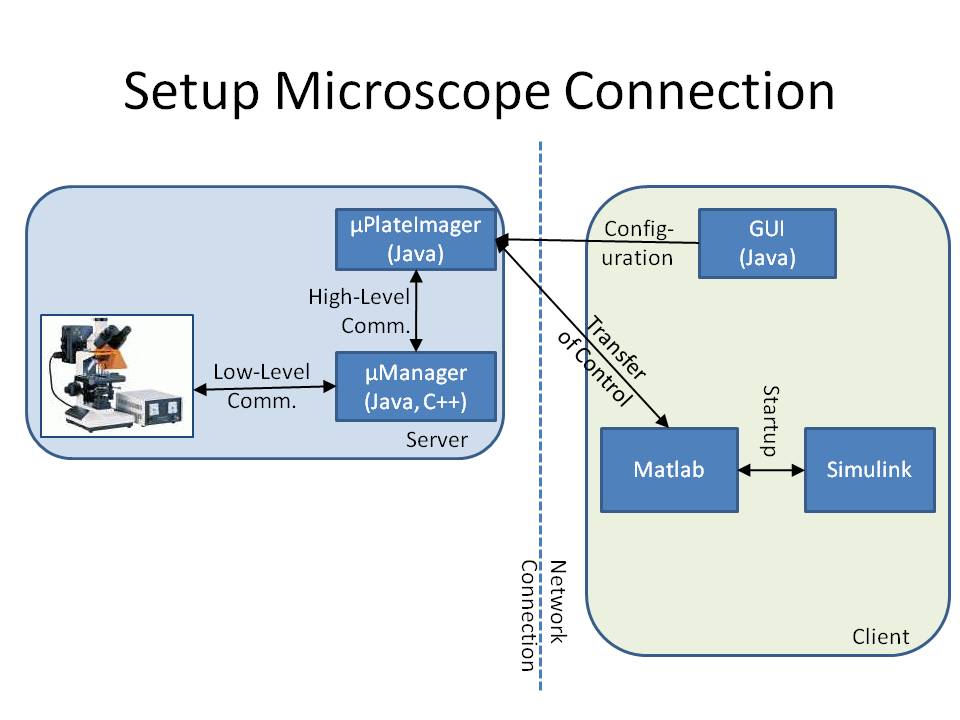
The imaging pipeline from the microscope to Matlab/Simulink
The microscope is connected to a workstation using the core drivers and interfaces of μManager (see Stuurman et al. (2007) or [http://www.micro-manager.org]). To provide a mechanism to change the cell's input signal depending on its fluorescence signal, we developed the microscope software μPlateImager, which enables for parallel acquisition of images and the modification of light input signals. μPlateImager uses the Java interface of the μManager core to control the microscope and can be configured by a separate platform-independent visual user interface. μPlateImager uses the undocumented Java MATLAB Interface (JMI) to connect to Matlab (The MathWorks, Natick, MA) based on the open source project matlabcontrol (see [http://code.google.com/p/matlabcontrol/]). The microscope thus can be closely controlled by standard Matlab scripts.
Toolkit (Simulink)
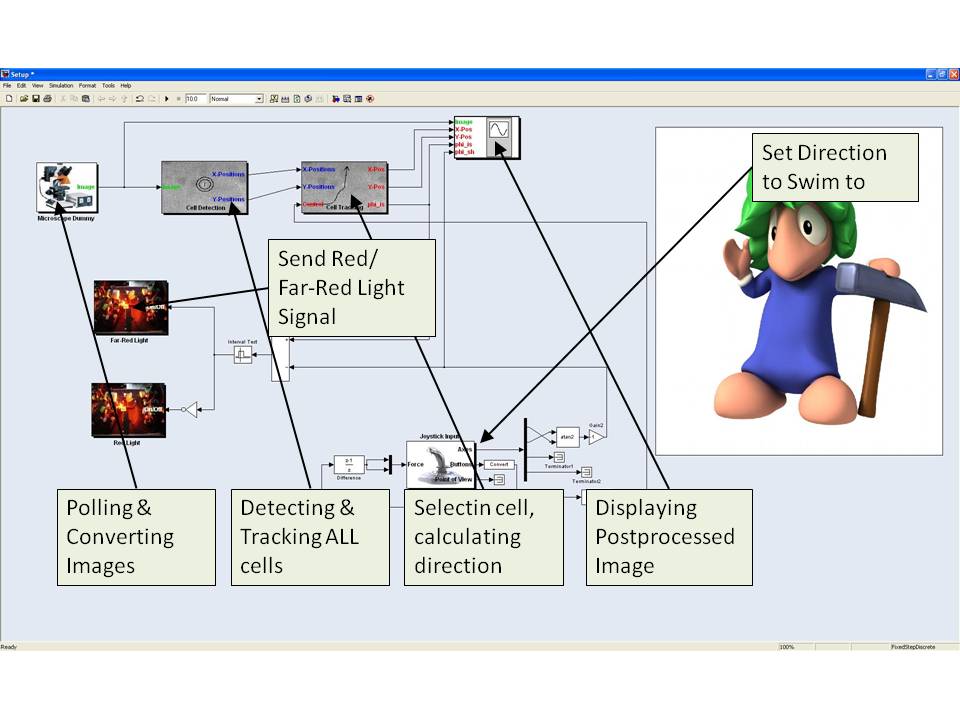
Graphical user interface with which the image analysis pipeline and the control algorithm can be defined
A Matlab script is executed by μPlateImager, which transfers the control over the microscope and automatically starts the GUI based on Simulink. The GUI consists of several blocks representing the single steps of the image analysis and the control of the microscope. First, the microscope block triggers the microscope to make an image and sends this image to the cell detection block, which detects all cells in the current image and tracks them between the several frames. This information is send to the next block which selects the cell to be controlled. Furthermore, by comparing the change in the position of the E. lemming over several consecutive images, the direction of the E. lemming is estimated. This data together with the raw image is send to the display.
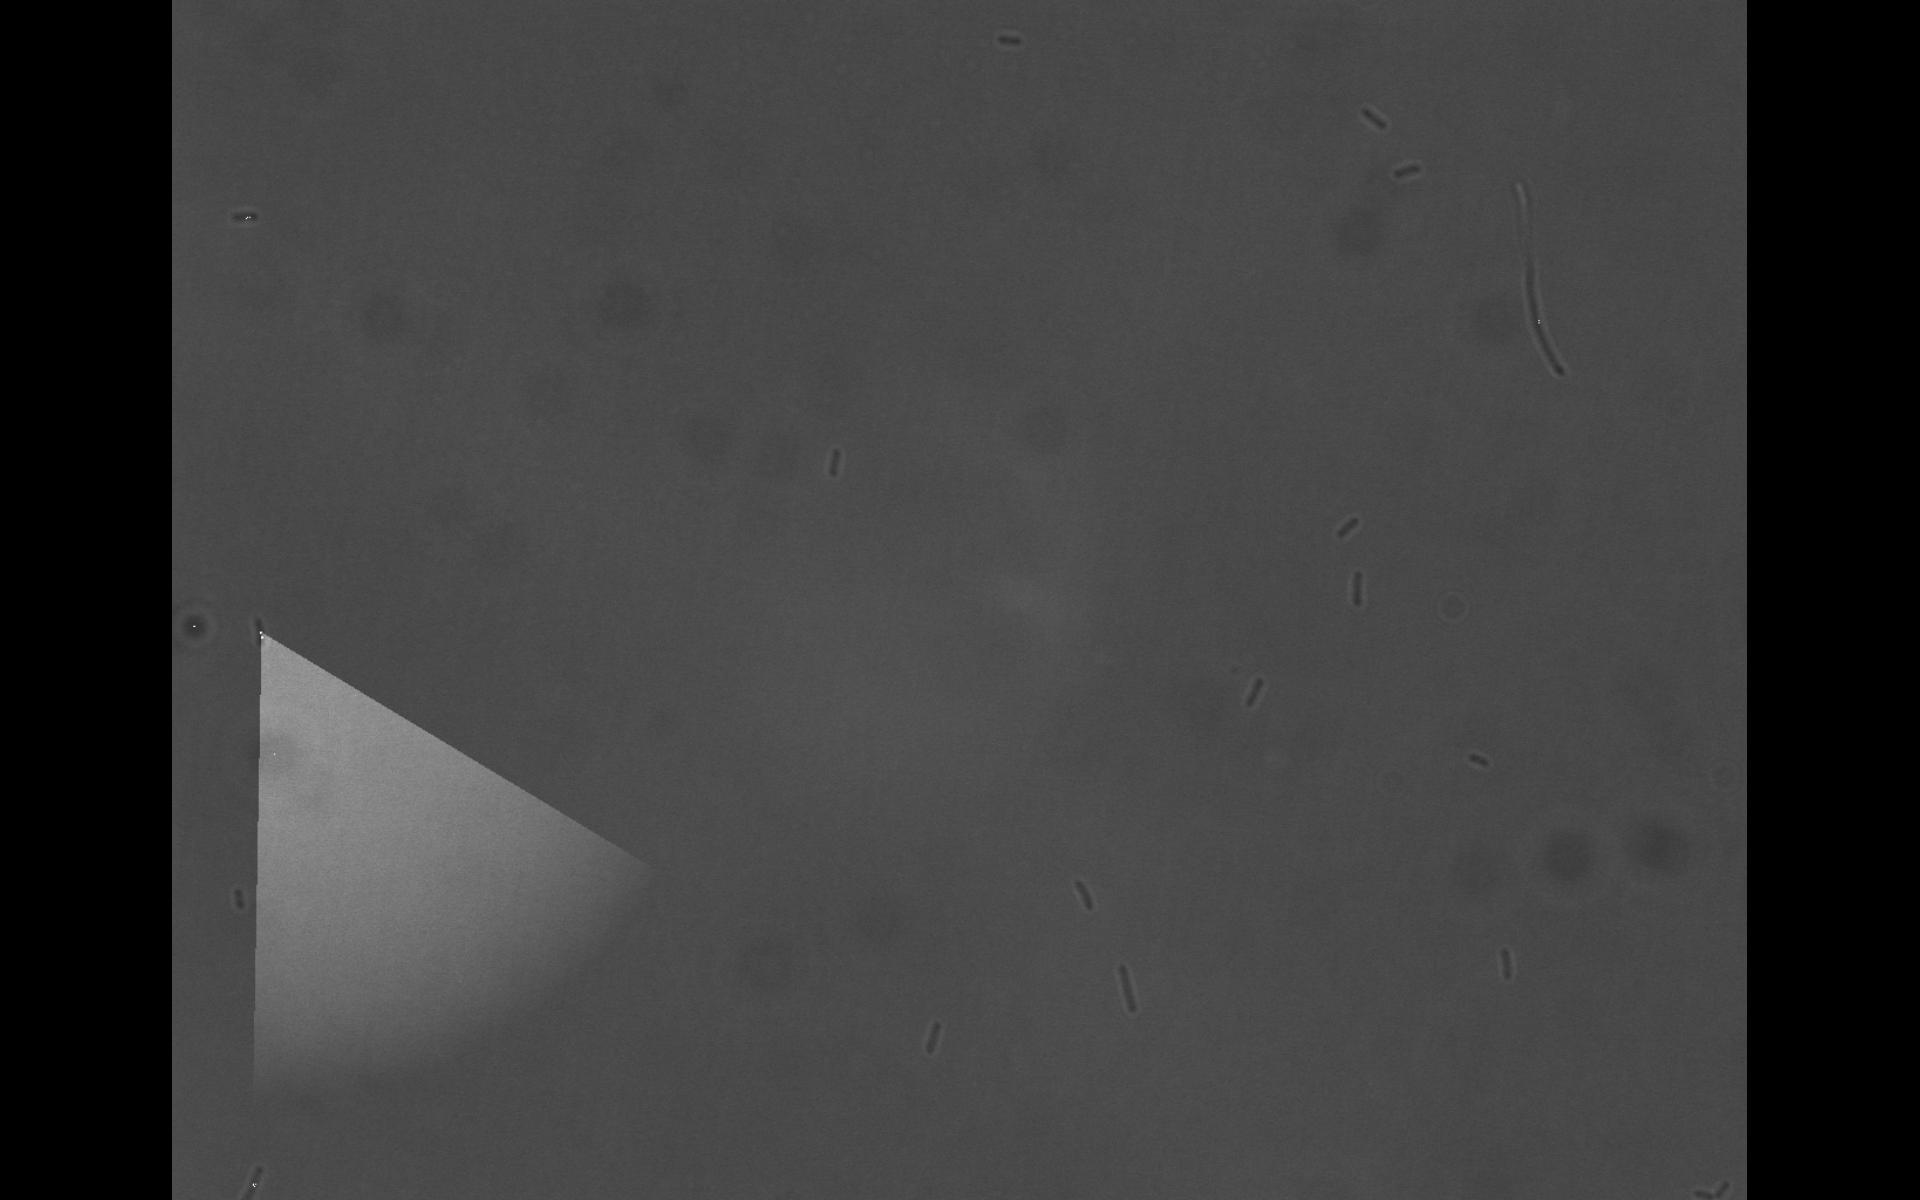
Output on the screen. The cone is visualizing the current direction of the selected E. coli.
The direction of the cell is automatically compared to the direction it should go. This direction can be intuitively defined by the user using a joystick. The force feedback functionality of the joystick is used to give the user an intuitive feedback of the current direction of the E. lemming. If the difference between the actual direction of the E. lemming and the direction the user defined is too high, tumbling is automatically induced by a red light (660nm) pulse. Otherwise tumbling is supressed by a far red light (748nm). Alternatively the user can induce the pulses directly using the buttons of the joystick.
If the cell is moving out of the image the microscope moves automatically such that the cell is always approximately in the center of the image.
 "
"


