Team:TU Delft/Modeling/MFA/results
From 2010.igem.org
MFA results
Alkane degradation
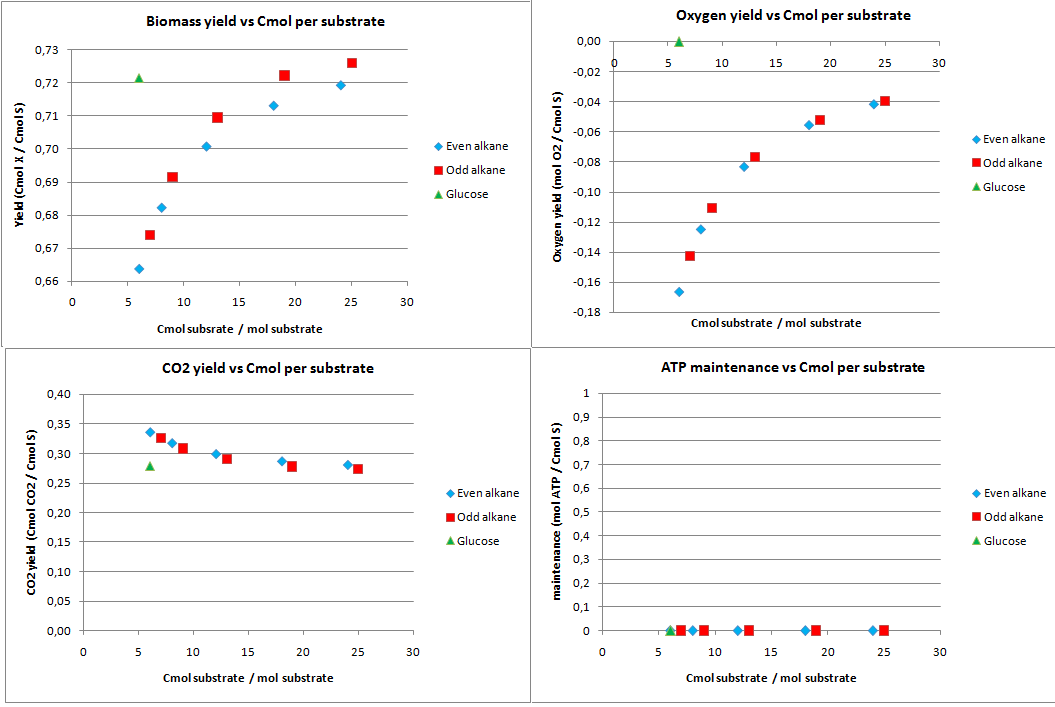
In figure 1 the biomass, oxygen, CO2 yields are plotted against the amount of Cmol of the product. Also the amount of ATP going into maintenance (essentially getting rid of the ATP) is plotted in figure 1. Glucose has 6 carbon atoms and for the alkanes a range 6 carbon atoms to 25 carbon atoms was taken. These results are for the construct with biobricks for alkane degradation as described by the project description.
The highest calculated theoretical maximal yield for biomass in Cmol per Cmol is achieved with an odd alkane with 9 carbon atoms. Here the yield is 0.853 Cmol of biomass per Cmol of substrate. For even alkanes the theoretical maximal biomass yield is constant at 0.788 Cmol biomass per Cmol substrate. For glucose this value is 0.775 Cmol biomass per Cmol substrate. With the optimization all the carbon atoms go to biomass and CO2, so the CO2 production is the highest for glucose and the lowest for odd alkanes.
The optimal alkane degradation does however consume more than three times as much oxygen than growth on glucose. Oxygen is often a limiting factor for growth and especially in oily environments the oxygen transfers less easily into the water phase. This additional oxygen consumption originates from the first step in the alkane degradation, which consumes oxygen and the large amount of co-factors that need to be regenerated, which can be seen from the high ATP surplus in the bottom right graph of figure 1. This large surplus of energy is just wasted because of the optimization, but in reality this energy may be used for something useful.
Minimal flux analysis
Another calculation was performed on the previous network. All influxes other than C12-alkane were set to zero. Then a certain growth rate was set and an optimization towards a minimal dodecane uptake was performed. The maintenance was not set as the network has many futile cycles in which ATP can be consumed. Setting a certain maintenance value will not change anything in the minimal uptake rate unless it is very high. The result of the analysis is displayed in table 1.
Table 1; results for minimal flux analysis
| Growth rate (h-1) | Dodecane uptake flux (mmol gx-1 h-1) |
| 0.01 | 0.0435 |
| 0.02 | 0.0871 |
| 0.05 | 0.2177 |
| 0.1 | 0.4353 |
| 0.2 | 0.8706 |
| 0.5 | 2.1765 |
| 1 | 4.3531 |
A clear linear connection can be seen between growth rate and minimal dodecane uptake. The conversion factor is 1/ YS,x. With YS,x being the yield of biomass on dodecane calculated in the yield calculations above.
NO3 as electron acceptor
This construct was introduced to see how much the oxygen consumption could be eliminated with growth on alkanes. In oily environments oxygen transfers poorly into the water phase. The calculated yields for the optimization to growth with NO3 as electron acceptor are displayed in figure 2.
The highest theoretical biomass yield is achieved with an odd alkane with 25 carbon atoms. The yield for biomass on glucose is only slightly lower. Biomass production on short-chained alkanes clearly has a lower yield, dropping up to 9% for the shortest alkanes.
The oxygen consumption for growth on glucose is completely eliminated and for the alkanes the oxygen consumption drops as the chain length increases. In this scenario the cell has no energy left over and the maintenance is zero.
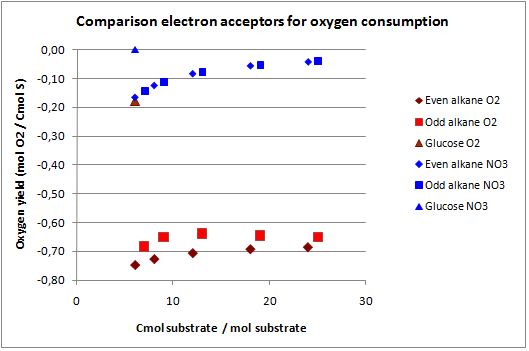
In figures 3 and 4 the previous scenario, the standard scenario with oxygen as electron acceptor, and the current scenario are compared in terms of biomass yield and oxygen requirement.
With NO3 as electron acceptor less ATP is produced per NADH and FADH2. This translates into a lower biomass yield as observed. The biomass yield drops 9% to 19% for the alkanes and 7% for glucose. The oxygen requirement however drops 77% to 94% for the alkanes and is completely eliminated for glucose. Over expressing this system may be very beneficial in oily environments.
PHB production
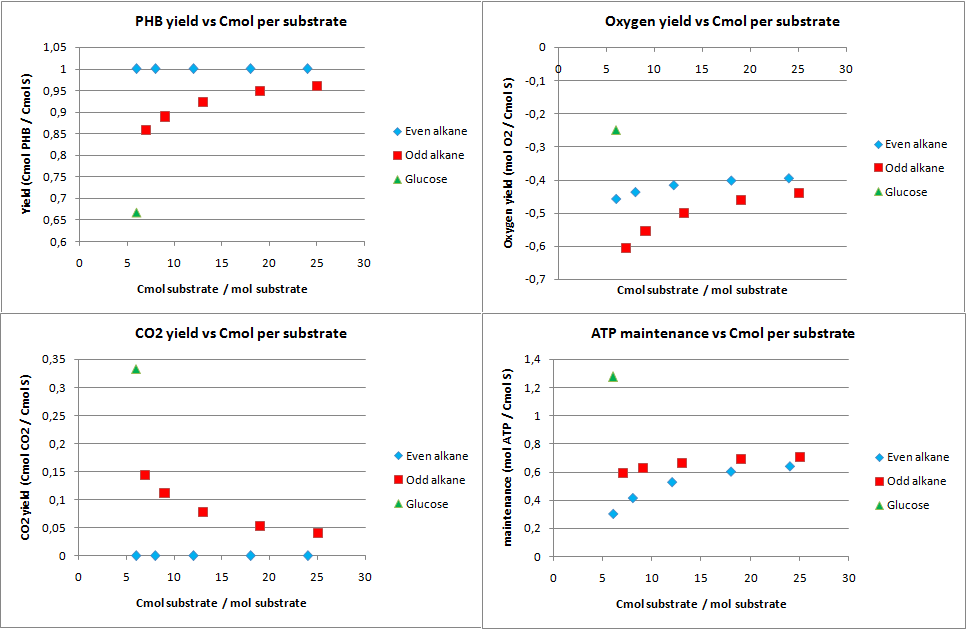
This scenario was proposed to see how well the alkane degradation could be used to produce an useful substance instead of biomass and CO2. The yields from the analysis for this scenario are displayed in figure 5.
For any even alkane the yield is 1 Cmol of PHB per Cmol of substrate. This is the highest achievable yield without any other carbon source. The CO2 for even alkanes is therefore also zero, as all carbon atoms go into the product. Odd numbered alkanes also have very high yields of 0.85 to 0.95 Cmol PHB per Cmol substrate. Glucose has a yield of 0.667 Cmol PHB per Cmol of glucose. This lower yield can be explained by the fact that the the PHB production pathway starts at a C2 molecule. Glucose splits into two C3 molecules which are then converted into C2 molecules by producing CO2. This generation of CO2 explains both the lower yields for glucose and odd numbered alkanes. Odd numbered alkanes produce propionyl-CoA, which is also a C3 molecule.
The system generates a lot of energy, the ATP left over is very high. This allows for growth and other options for the cell if the yield for PHB is less then theoretically maximal.
isoprene production
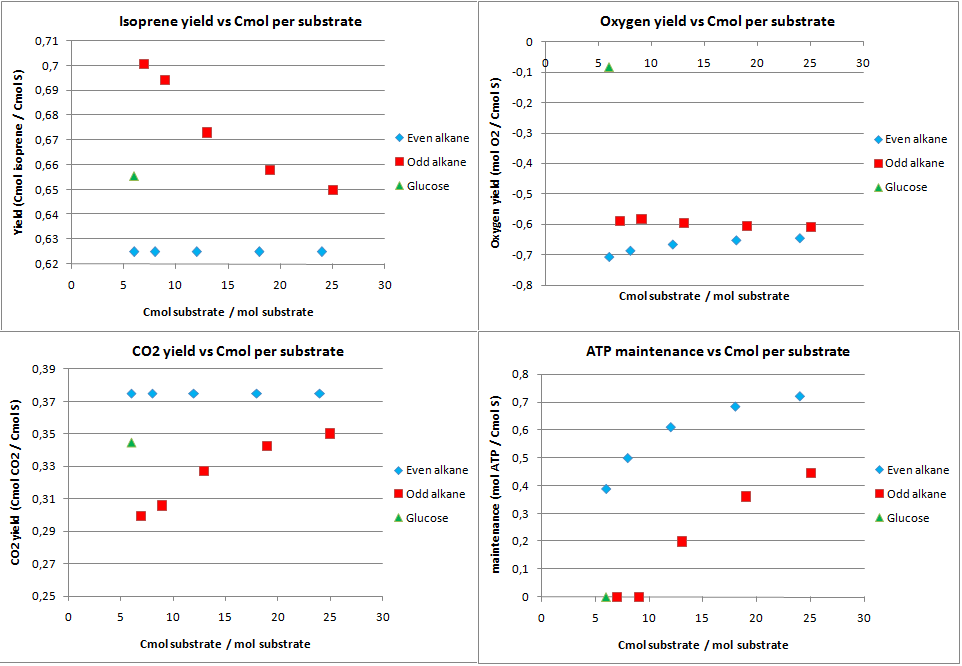
Isoprene production was chosen as a hypothetical pathway. Although it is an unlikely product for E. coli, in theory it holds much promise as it is very reduced. The calculated yields from the metabolic flux analysis are displayed in figure 6.
The product yields for isoprene are lower than for PHB in the previous case. The upper limit is only 0.833 Cmol isoprene per Cmol substrate, as in the first step of the isoprene pathway 2 C3 molecules are used to form a C5 molecule and CO2. The yields for isoprene on alkanes are further lowered because the acetyl-CoA (C2) needs to be converted to C3 molecules. This leads to CO2 production through the anapleorotic routes and therefore in a drop of the yield. This also why short-chained odd numbered alkanes have a higher yield as the ration propionyl-CoA/acetyl-CoA is higher for shorter odd numbered alkanes. The yield for glucose is lower than the absolute maximum because substrate needs to be consumed for production of co-factors that are required for the isoprene pathway. This is also reflected by the fact that no ATP is going to maintenance with glucose as substrate.
Comparing isoprene and PHB production, it can be concluded that if one wants to produce something efficiently from alkanes in terms of carbon atoms one prefers a pathway that uses C2 molecules as precursor.
hydrogen production
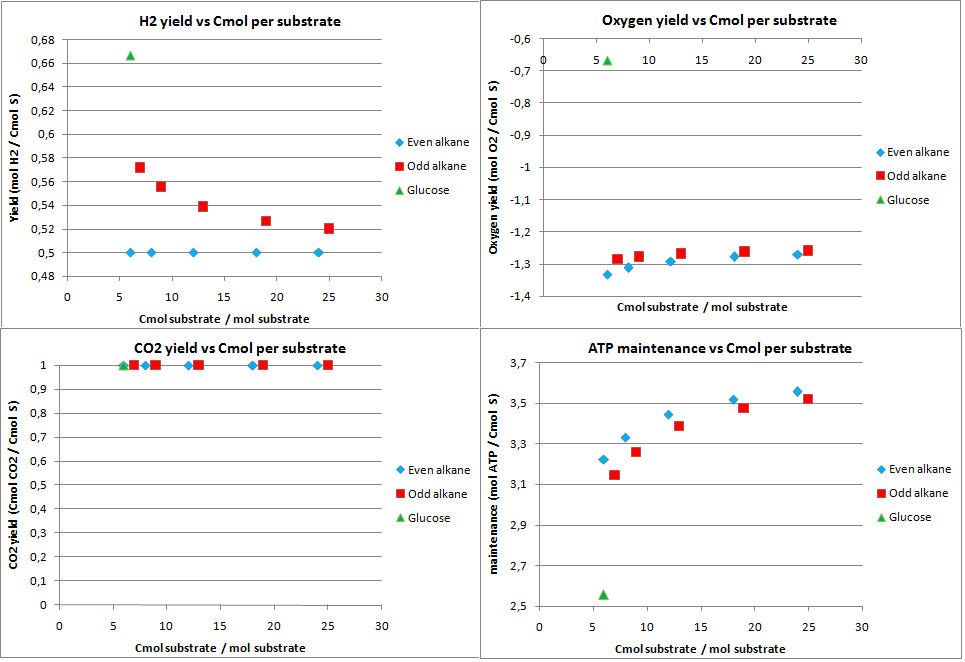
In this scenario the production possibilities for hydrogen were investigated. The calculated theoretical maximal yields for an optimal production of hydrogen are displayed in figure 7.
As expected the CO2 production for hydrogen is very high, the 1 Cmol of CO2 is produced per Cmol of substrate. Also the yield for hydrogen on the alkanes is quite low. This also because the acetyl-CoA needs to be converted to pyruvate, a C3 molecule. This results into CO2 production and a drop in the yield as with isoprene. Furthermore the system has a huge excess of energy.
Combining the low maximal theoretical yields and the enormous CO2 production, it can be concluded the hydrogen is not a very attractive product to produce from alkanes.
Go back to the MFA main page here
 "
"

