Team:TU Delft/Modeling/HC regulation/Sensitivity
From 2010.igem.org
Sensitivity analysis
In this study we analyze the effect of
- The maximal protein production rate b (lumped variable for transcriptions speed, translation speed, promoter strength and rbs strength),
- The equilibrium constant ll K.
Using a sensitivity analysis. Therefore the parameter values were varied in the range of 50% to 200% of their original values.
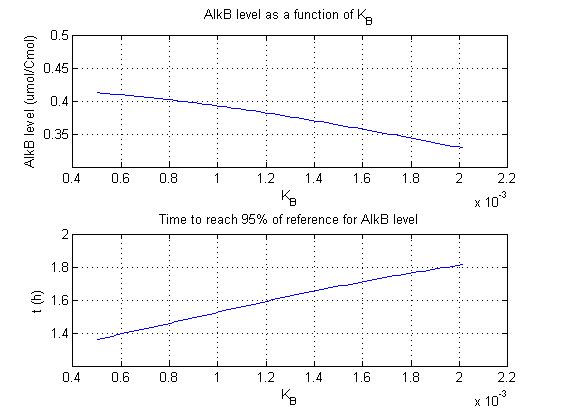
The variation is performed in small steps, a simulation is performed and the concentration of AlkB as well as the time for reaching 95% of the reference value are displayed.
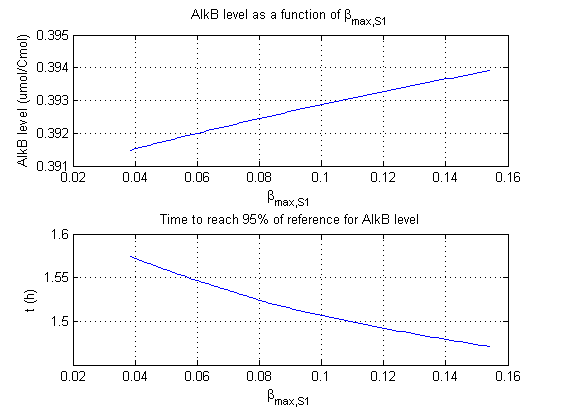
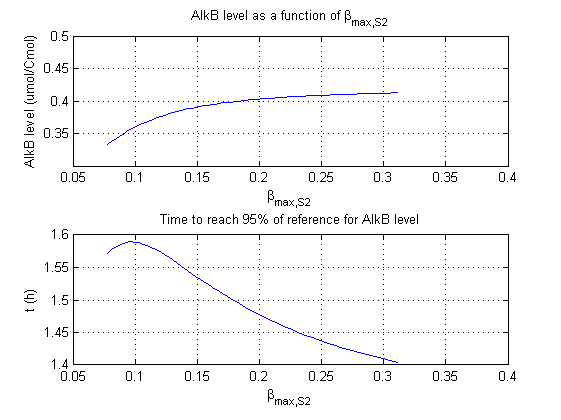
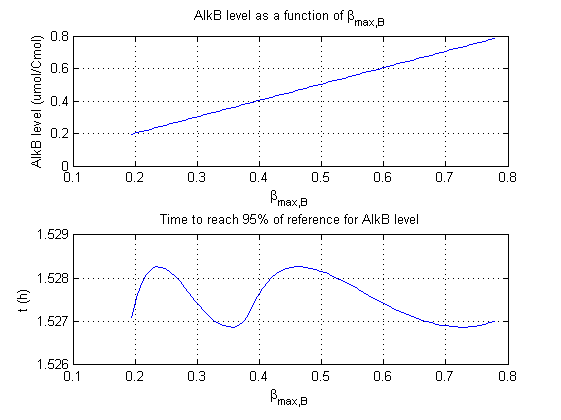
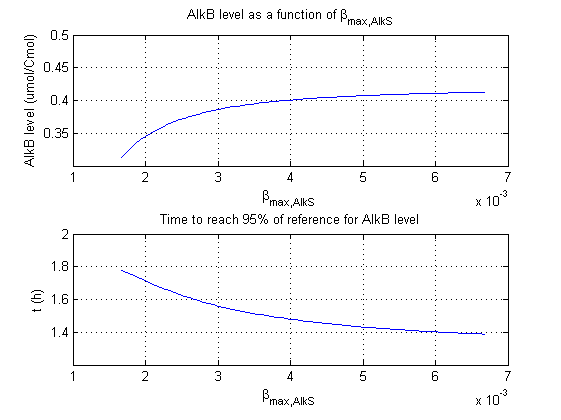
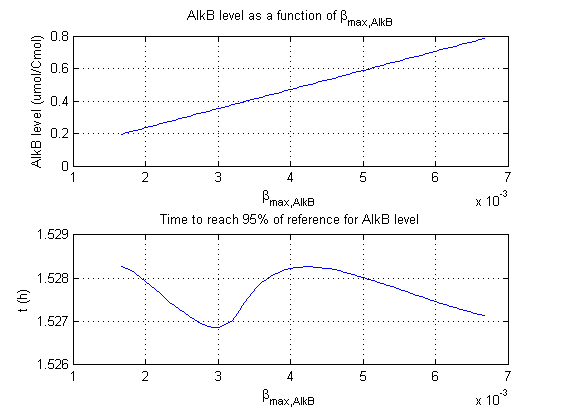
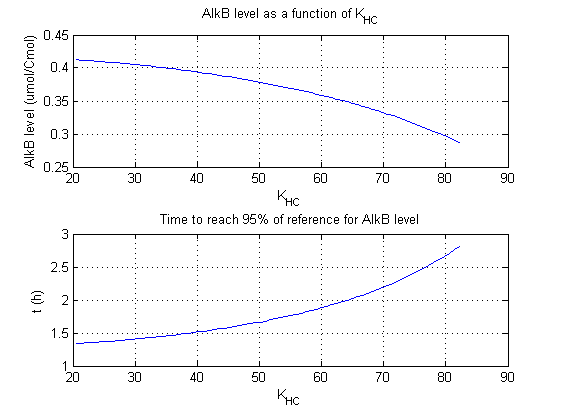
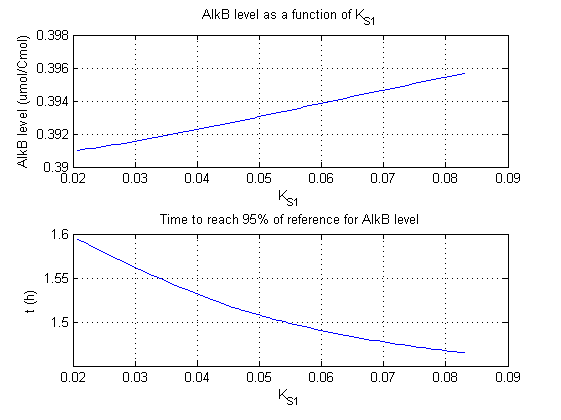
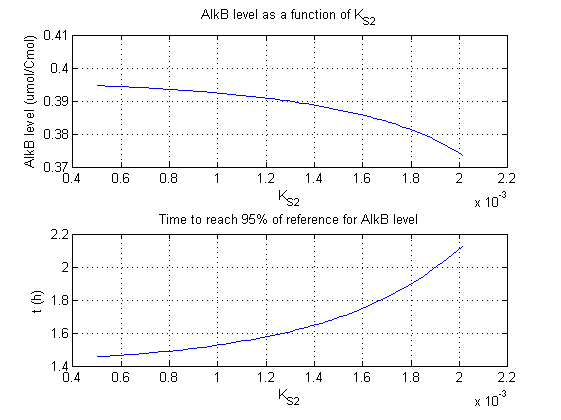
The time and steady-state concentration for the variation study of βmaxS1, βmaxS2, βmaxB, βmaxAlkS, βmaxAlkB are shown in Fig. 1 - 5. The influence of binding affinities is shown in Fig. 6-9.
Conclusion
Most parameters have a linear or slightly exponential effect on the steady state concentration. The time it takes to reach steady state is more complexly correlated to the parameters. The wave functions for βmaxB and βmaxAlkB can be explained (1) by the small variations (see scale) and (2) numerical integration errors resp. interpolation artifacts.
The results of the parameter variation study are summarized in table 1.
Table 1; results for sensitivity analysis for the gene regulation model: '0': insensitive, '+' sensitive, '++' very sensitive.
| Parameter | Sensitive for steady state concentration | Sensitive for reaching steady state concentration |
| βmaxS1 | 0 | + |
| βmaxS2 | + | + |
| βmaxB | ++ | 0 |
| βmaxAlkS | + | + |
| βmaxAlkB | ++ | 0 |
| KHC | + | + |
| KS1 | 0 | + |
| KS2 | + | + |
| KB | + | + |
βmaxS1 and βmaxS1 have the strongest effect on the steady state concentration of AlkB. These parameters have a direct influence on the production rate of of AlkB and the mRNA translation rate of AlkB in the ODE model. Interestingly they have no significant influence on how fast the system reaches steady state.
The second observation that can be made from the results is that βmaxS1 and KS1 have no significant influence on the steady state concentration of AlkB. This can be explained by the fact that pAlkS1 is more repressed at high alkane concentrations and under these condition the contribution of AlkS to the production of AlkB is low.
Go back to the model explanation here
Go back to the main modeling page here
 "
"
