Team:HokkaidoU Japan/Notebook/August24
From 2010.igem.org
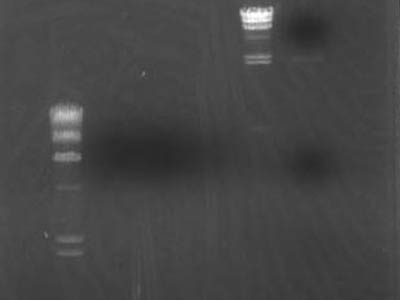
Check to see if digestion visualization Primers Work
- All 4 of PCR products were purified via Microcon YM-10
| Lane | DNA |
| 1 | TSUDA Marker I |
| 3 | RBS |
| 4 | GFP |
| 5 | double terminator |
| 6 | Promoter |
Promoter band in lane 6 wasn't visible
- This vector didn't have a primer annealing site for our new primers
Check of Ligation Mixtures
TAKARABIO's Ligation Mixture [I] and Ligation Mixture Mighty Mix [M]
- After PCR and gel extracted pSB1C3 volume of either Ligation Mixture equal to pSB1C3 solution volume was added
- Transformed
- incubated in 200 uL of LB medium
- 100 uL of each solution was plated on mediums containing 34 ug/uL and 12 ug/uL of chloramphenicol
Various Checks
| Lane | DNA |
| 2 | λ/Hind III |
| 3 | Ligation between pSB1C3 vectors |
| 4 | Product obtained by using digestion visualization primer for 1-2N |
| 5 | Flow through of digestion visualization primer for 1-2N |
| 6 | λ/Hind III |
| 7 | Gel extracted pSB1C3 |
Band weren't visible in lane 3
- Dimers, trimers and etc were hardly visible maybe severely diluted
In lane 7 had detectable by very weak band
- There weren't any problems with gel extraction
 "
"


