Team:Michigan/Pili October
From 2010.igem.org
| Sunday | Monday | Tuesday | Wednesday | Thursday | Friday | Saturday | |
| Week 14 | - | - | - | - | - | - | 10/2/2010 |
| Week 15 | 10/3/2010 | - | - | - | 10/7/2010 | - | - |
| Week 16 | - | - | - | 10/13/2010 | - | 10/15/2010 | - |
| Week 17 | - | 10/18/2010 | 10/19/2010 | 10/20/2010 | 10/21/2010 | 10/22/2010 | - |
Back to Pili Main Notebook Page
10/2/2010
Kevin
Prepared tubes with K12 and ΔFim (Both w/insert) for an agglutination assay. We added algae and arabinose at an OD600 of 0.8 and then let the tubes grow.
10/3/2010
Kevin
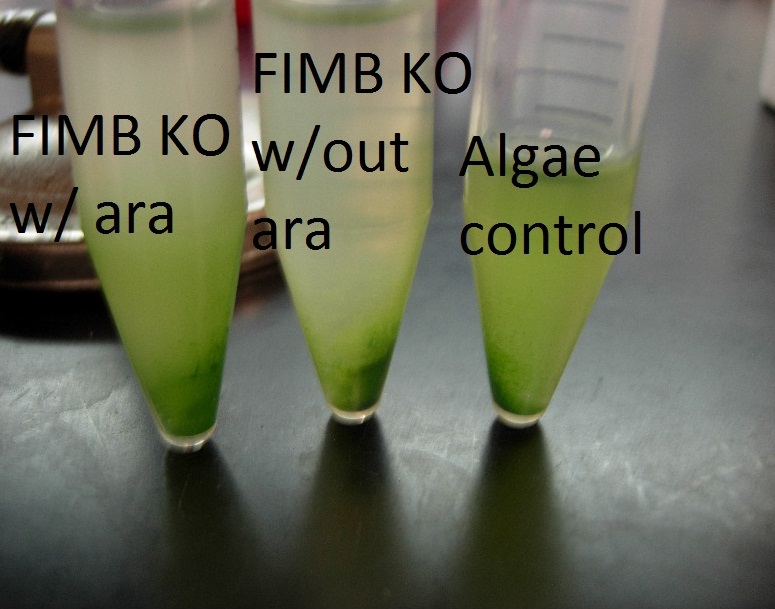
We were able to observe pellets in the tubes containing ΔFimB w/insert. This is exciting, but there are several things to note:
- By looking at the pellets under a microscope, we were able to see many flocs, some of which were a combination of E coli and algae, and some of which were pure E coli. This is a promising result.
- Both induced and uninduced tubes of ΔFimB formed flocs, however the arabinose induced tube had a much larger floc. This is possible evidence of leaky expression.
- None of the K12 tubes formed flocs.
We are planning to run a more quantitative assay later this week.
10/7/2010
Kevin
Ran flocculation assay.
- Prepared O/N cultures of K12 and ΔFimB, both with the FimB plasmid.
- Created 5 tubes: LB, LB+ΔFimB (both uninduced and induced), LB+K12 (both uninduced and induced)
- Used 5 ml of cell culture due to low algae culture available
- Added 100 ul arabinose during exponential phase
- Added 5 ml algae to every tube
- Shake for 10 min
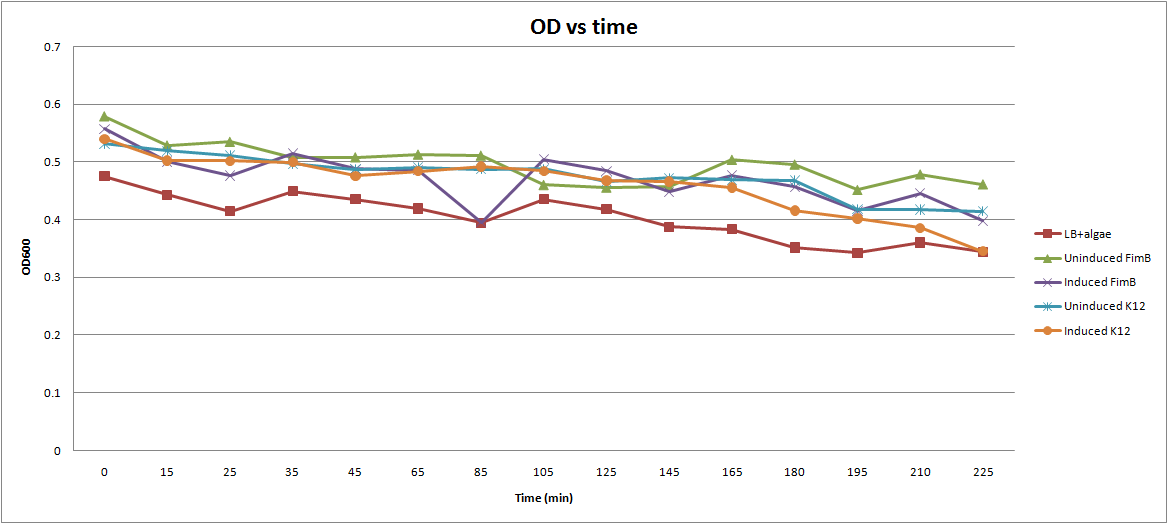
- Take 200 ul samples and measure OD600.
This graph illustrates the results. We can see a decline in the OD600 for all species, but there is no clear distinction between our control tube (LB+Algae) and the other tubes containing E. coli.
Suggested Modifications:
- This procedure was originally developed to measure a fast-acting chemical flocculant. Clearly, the time-scale will have to be changed to adjust for the slower E. coli.
- In between measurements, the tubes were allowed to sit at room temperature. It may be more beneficial to put the tubes in the incubator shaker, and take measurements less frequently.
- If we wait 2-3 hrs for the arabinose to fully induce and then start taking measurements, we should get better results.
Marc ran another qualitative assay, with positive results.
10/13/2010
Kevin
Ran PCR of FimB in preparation of making our final iGEM BioBrick standard part.
10/15/2010
Kevin
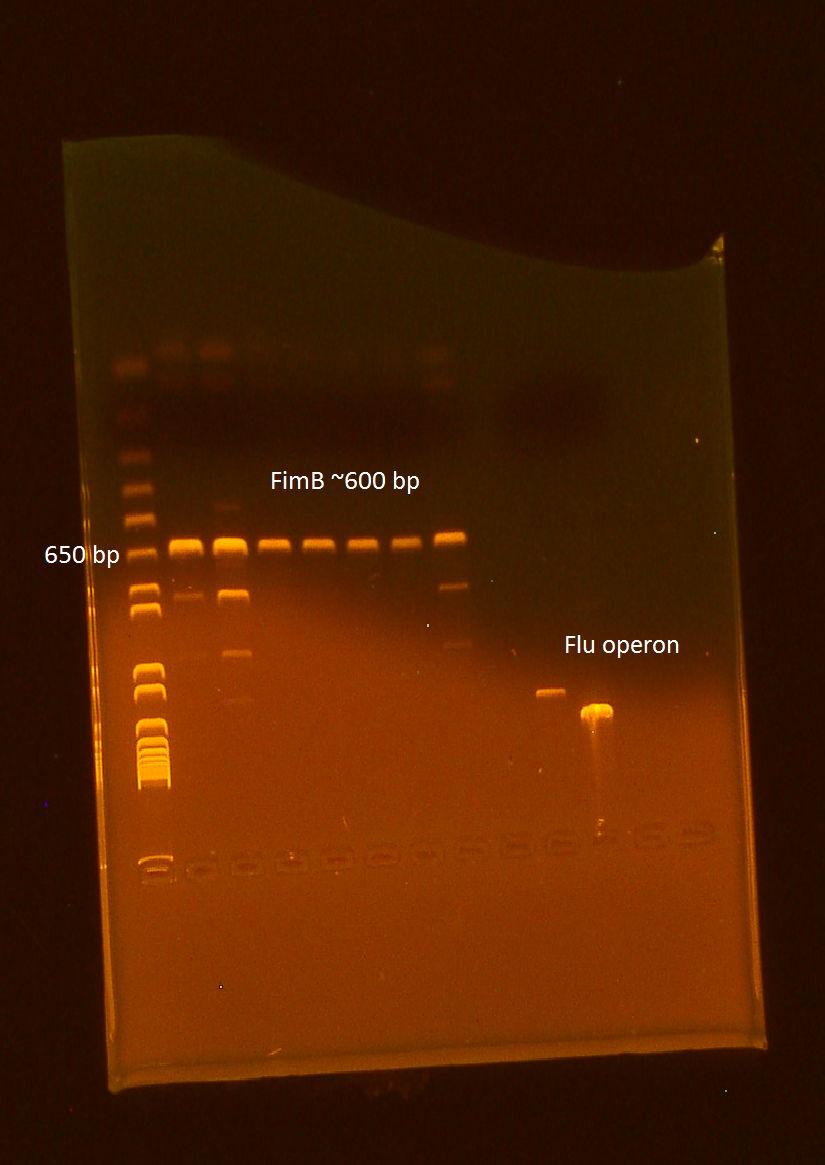
Ran gel of PCR products from 10/13. It appears that all of our wells contain our intended product, however 3 wells appear to contain unexpected products as well.
10/18/2010
Kevin
PCR purified the FimB PCR product, using the PCR purification kit in 1230 ERB. Started o/n cultures of ΔFimB and K12 in preparation of another OD assay.
Performed nanodrop to determine concentration of products.
- I had two separate tubes of product due to the PCR purification.
Results:
| FimB Digest 1 | FimB Digest 2 | |
|---|---|---|
| 260/280 | 1.85 | 1.86 |
| 260/230 | 2.10 | 2.02 |
| ng/uL | 39.2 | 36.0 |
Performed digest of FimB, using EcoR1 and Pst1. Ran the digest alongside VP130 and Flu.
Performed ligation of FimB into pSB1C3, the standard iGEM plasmid backbone. Used the quick ligation kit.
Performed transformation of FimB into competent cells. Made plates of 1:1 and 1:3 dilutions.
10/19/2010
Kevin
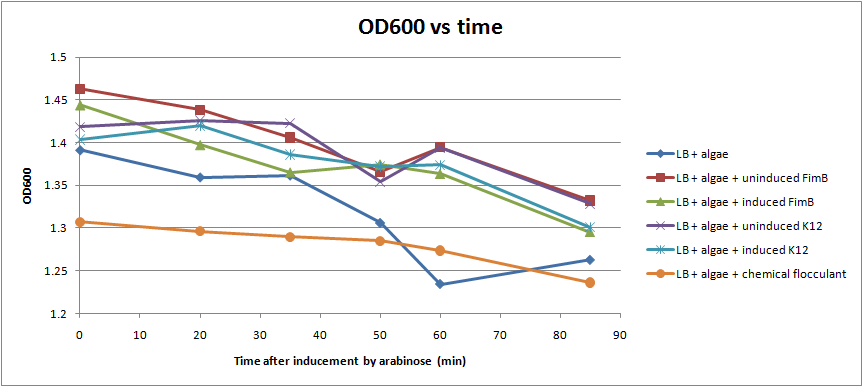
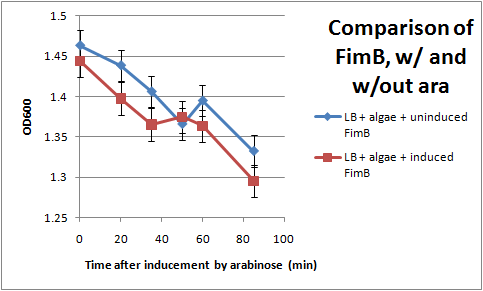
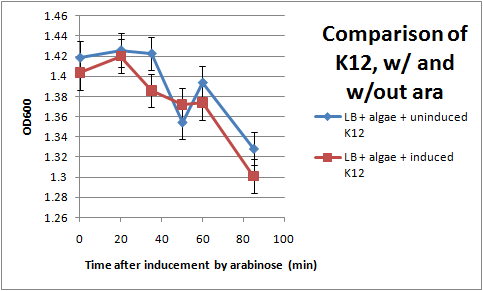
Ran another OD assay to measure rate of flocculation. One key improvement in this assay is that I was able to run triplicates of each sample, to get a more accurate reading. I also started collecting data 3 hrs after inducing with arabinose, to give the cells time to grow pili. All cultures used contained the pBAD-FimB plasmid, although not all were induced.
After discussing the results, we feel as though this data does not show significant difference in the strains during the measured time period. The difference in the rate of OD change for the uninduced and induced strains is not particularly large, and is within standard error. In the future, we would like to run more controls. Positive controls could include strains that are guaranteed to produce pili, while negative controls would be strains that do not produce pili. We also want to discover if there are contaminants that cause the algae to flocculate by itself.
10/20/2010
Kevin
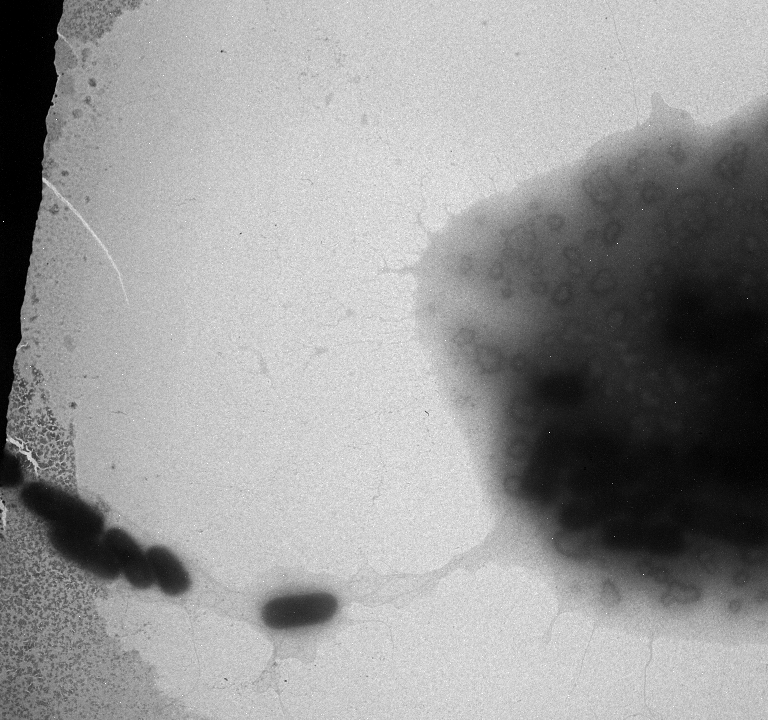
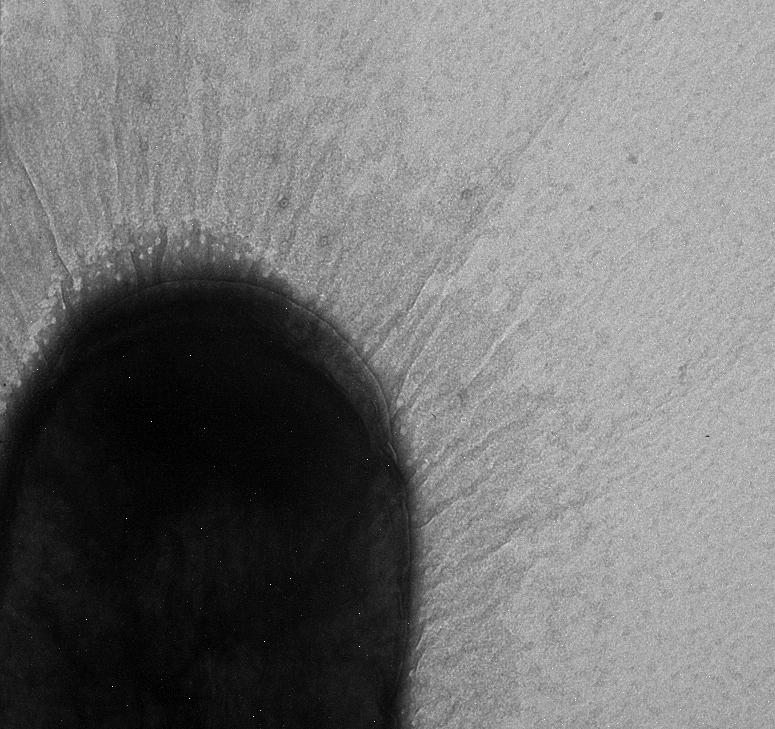
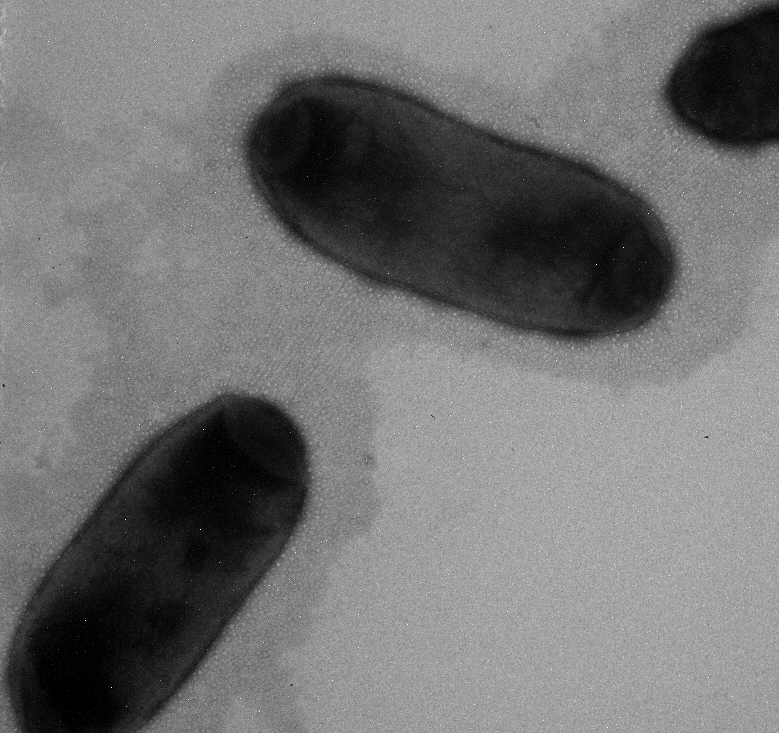
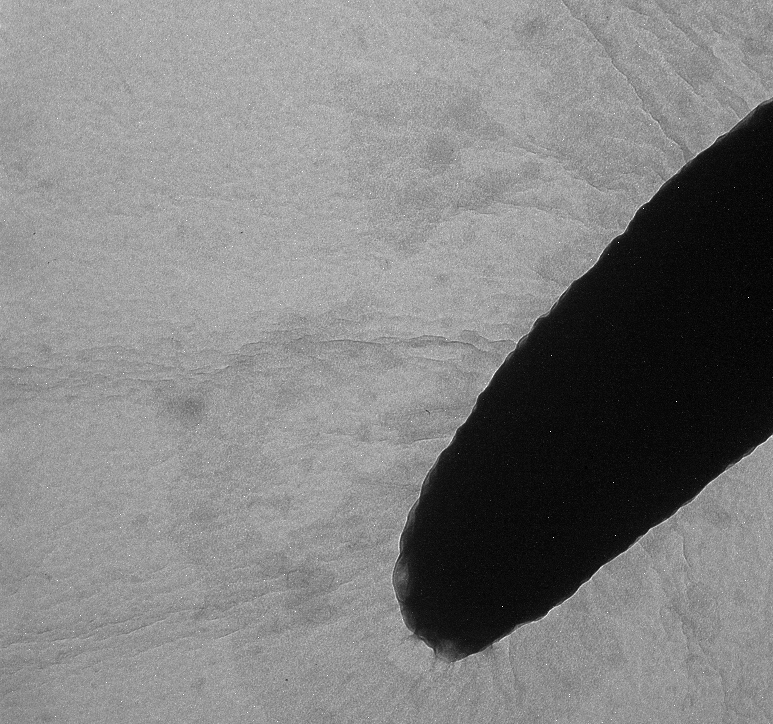
Used an electron microscope in the Natural Science Building in an attempt to search for pili. Unfortunately we were not able to see any, but we did find a strange exo-polysaccharide around some of our strains. We will run more strains under the EM (including some positive controls)
10/21/2010
Kevin
Grew cultures in 2095 Nat. Sci. in preparation of further EM pictures.
10/22/2010
Kevin
Marcus used the EM today and collected more pictures.
 "
"

