Team:TU Delft/Project/alkane-degradation/results
From 2010.igem.org

Alkane Degradation Results & Conclusions
Characterization of the alkane hydroxylase system
Growth analysis
We attempted to culture our recombinant AH-carrying E.coli K12 strains ([http://partsregistry.org/Part:BBa_K398014 BBa_K398014]) on 1% v/v octanol or 1% v/v dodecane. Negligible growth was observed.
Resting-cell assays
The resting cell assays were performed on our recombinant AH-carrying E.coli K12 cells ([http://partsregistry.org/Part:BBa_K398014 BBa_K398014]). 100 micromoles of octane was added to 6 mL of growth-stalled cells (1.5 mg cell dry weight total) and incubated at 37 degrees with shaking o/n. The organic phase was extracted using EtOAc and analysed by gas chromatography.
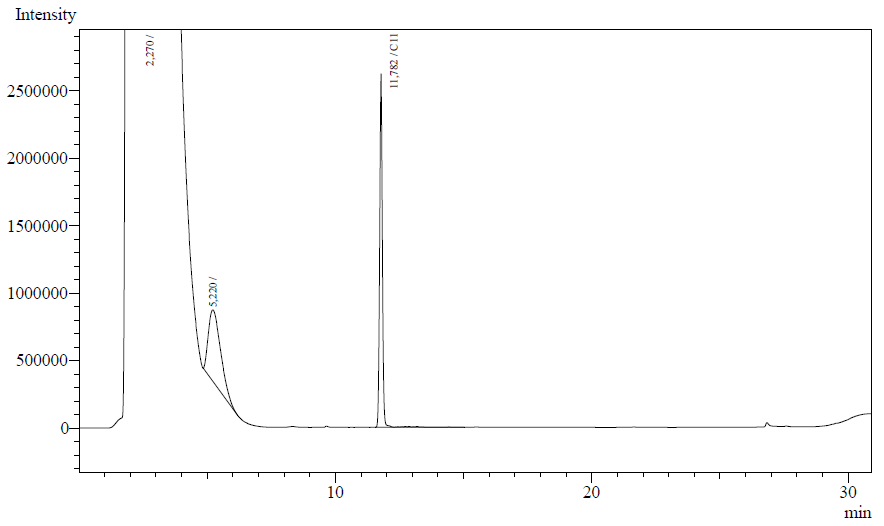
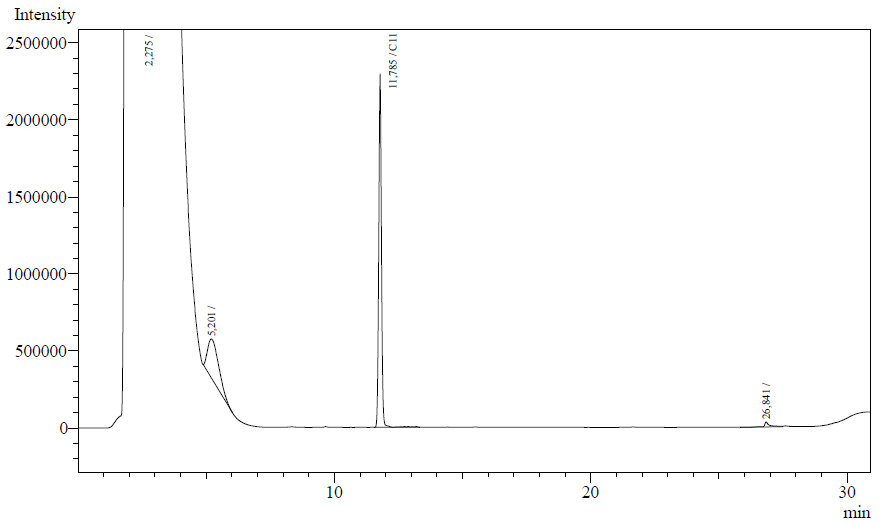
The following are examples of typical chromatographs obtained:
The peaks shown in the chromatographs belong to the following compounds:
| Retention time [min] | Compound |
| ~2.2 | Ethyl acetate (solvent) |
| ~5.2 | Octane (substrate) |
| ~11.8 | Undecane (internal standard, 0.1% v/v of solvent) |
The surface areas of the peaks correspond to the amount of molecules present in the sample. Due to the fact that many factors play a role in establishing an equilibrium between the aqueous and organic phase once the EtOAC is added, it's general procedure to add an internal standard to the EtOAc. In our experiment we decided to use a 0.1% vol/vol of undecane in EtOAc. The ratio between the surface areas of octane and undecane can now give an indication of the amount of octane still present in the sample and be very useful for comparisons between chromatographs.
The following table contains the surface areas found for the peaks of octane and undecane for each obtained chromatograph:
| Strain | Octane surface area | Undecane surface area | Ratio octane/undecane |
| E.coli K12 negative control | 17903555 | 19939270 | 0.898 |
| E.coli K12 014#2 | 17426721 | 24262069 | 0.719 |
| E.coli K12 014#7 | 7824594 | 17320861 | 0.452 |
LadA
Characterization of the Alcohol DeHydrogenase (ADH) system
Growth on alcohols as sole carbon source
- As we described before, we tried to grow our strain Escherichia coli 018A ([http://partsregistry.org/Part:BBa_K398018 BBa_K398018] on the plasmid pSB1A2) on the alkanols Octanol-1 and Dodecanol-1 (1% V/V on M9 medium without any other carbon source). No growth was observed after 48 hours. We abandoned this experiment after this result.
Resting cell assays
- We grew Escherichia coli 018A and Escherichia coli negative control (Biobrick BBa_J13002 on plasmid pSB1A2 ) in 50 mL of M9 medium with glucose and CAS aminoacids.
- The cells were harevested when the O.D. at 600nm was around 0.3; they were spun down at 4000 rpm, for 10 min at 4ºC. And the resting cell assays were prepared according to the standard protocol
| Strain | O.D. |
| J13002 | 0.327 |
| 018A | 0.338 |
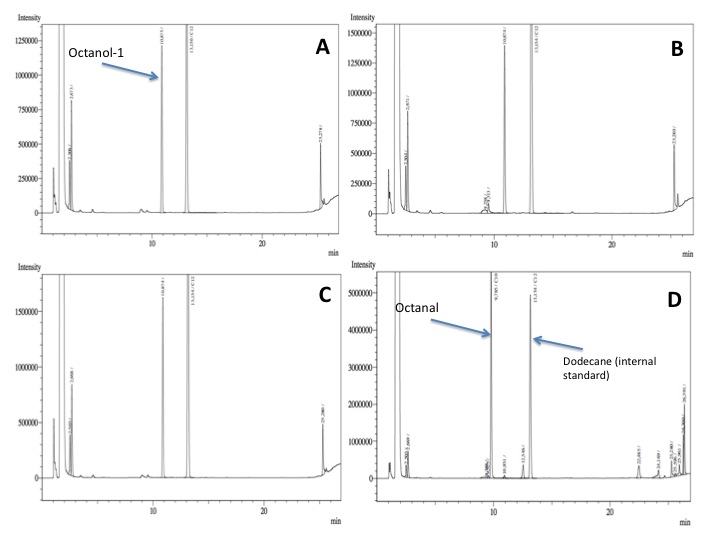
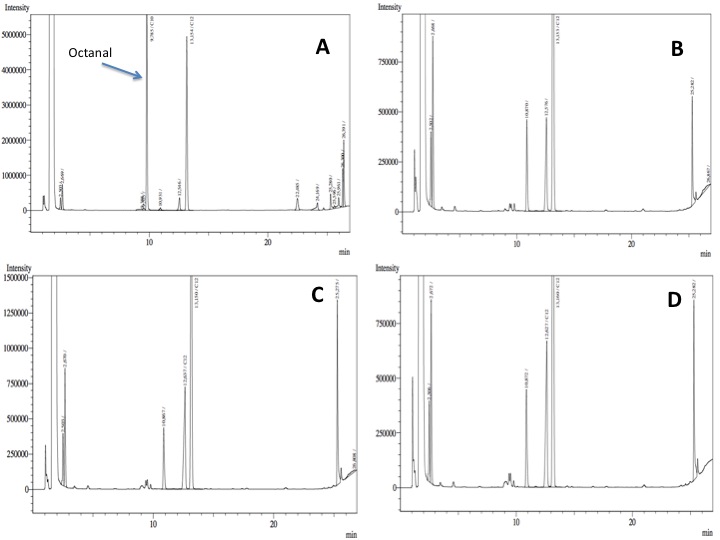
- After an overnight incubation at 37ºC, the organic phase was extracted using 3 mL of ethyl acetate (dodecane was used as internal standard). We tried to determine production of alkanals or alkanoic acids by Gas Chromatography measurements. The chromatograms are shown below:
- According to our results there was no degradation of octanol-1 ='( , after this experiment the protocol was abandoned. We think that the cells lack of transporters for long-chain alcohols, we preferred to check the cell extract in order to know if there was any biological activity in the cytoplasma.
NADH production in cell extracts
- EXPERIMENT 1
Cells were cultured in 50mL of LB medium and harvested when the O.D. 600nm of the culture was around 0.6. Two different cultures of the recominant strain and the negative control were prepared.
| Strain | O.D. 600nm |
| J13002 (1) | 0.654 |
| J13002 (2) | 0.621 |
| 018A (1) | 0.615 |
| 018A (2) | 0.580 |
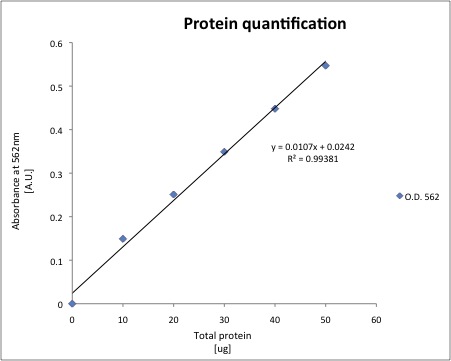
Cytoplasmic proteins were extracted using our standard protocol. And a standard curve for protein quantification was prepared.
The total protein of each sample was quantified using 20uL of cell extract, the results are shown below.
| Sample | O.D. 562 nm | Total ug of protein | ug/uL |
| J13002(1A) | 0.135 | 10.393 | 1.0393 |
| J13002 (1B) | 0.135 | 10.393 | 1.0393 |
| J13002 (2A) | 0.128 | 9.7363 | 0.9736 |
| J13002 (2B) | 0.129 | 9.8302 | 0.9830 |
| 018A (1A) | 0.097 | 6.8275 | 0.6827 |
| 018A (1B) | 0.091 | 6.2645 | 0.6264 |
| 018A (2A) | 0.092 | 6.3583 | 0.6358 |
| 018A (2B) | 0.092 | 6.3583 | 0.6358 |
The alcohol dehydrogenase activity was measured using the standard protocol and Dodecanol-1 as substrate. You can download our raw data by clicking on the link: File:TUDelft ADH raw.xls
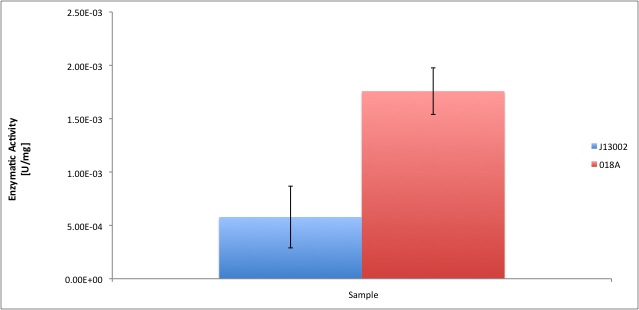
After the data treatment, the results that we obtained were the following:
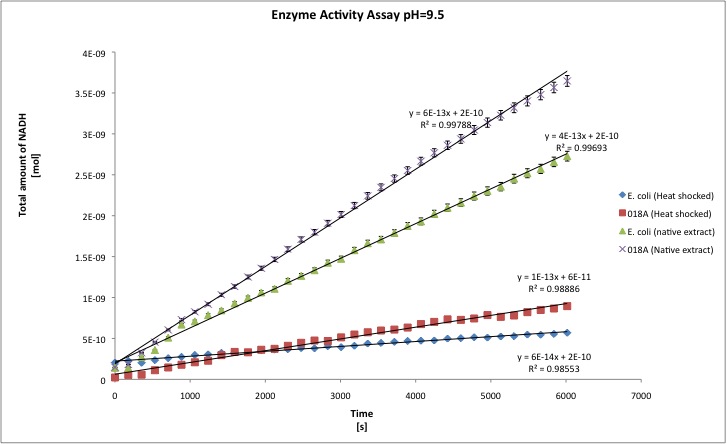

- All the enzyme activities were normalized to the TOTAL amount of protein in the cell extract. The results are shown in katal per mg of protein in the cell extract and Enzymatic Units per mg of protein in the cell extract.
| pH=9.5 | pH=8 | |||||||
| Heat | Native | Heat | Native | |||||
| J13002 | 018A | J13002 | 018A | J13002 | 018A | J13002 | 018A | |
| kat/mg | 6,156E-12 | 1,941E-11 | 1,053E-11 | 2,806E-11 | 3,211E-12 | 4,496E-11 | 1,302E-11 | 2,638E-11 |
| U/mg | 3,694E-04 | 1,091E-03 | 6,317E-04 | 1,694E-03 | 1,927E-04 | 2,139E-03 | 7,811E-04 | 1,608E-03 |
| stdev | 1,157E-12 | 4,579E-12 | 1,343E-12 | 9,961E-13 | 6,395E-12 | 2,331E-11 | 6,511E-13 | 9,961E-13 |
| Improvement | - | 215,34% | - | 166,51% | - | 1299,87% | - | 166,51% |
| ttest | - | 0,9963 | - | 1,0000 | - | 0,9988 | - | 1,000 |
You can download our results file here: File:TUDelft ADH results.xls Maybe you are not familiar with the term "katal", officially the katal is the STANDARD UNIT FOR CATALYTIC ACTIVITY in the International System of Units; the katal is defined as the amount of enzyme that converts 1 mol of substrate each second. [http://www.clinchem.org/cgi/content/full/48/3/586 Click here] to know more about it, and because people are not that familiar with the term, we report the activities in U/mg. One enzyme activity unit is defined as the amount of protein that converts 1 umol of substrate each minute. T-tests were performed in order to show that there is a difference between E. coli and our recombinant strain; a result for t-test of 1 means that both samples are statistically different; whereas a t-test of nearly 0 means that samples belong to the same group (no difference between both). Our level of significance is 0.025, in two tailed test. That means that if our t-test result is 0.95 we conclude that both samples are statistically different, whereas 0.949 or lower means that both samples are not statistically different.
- EXPERIMENT 2
We ran a second experiment at pH 9.5, with two other strains that seemed to be positive in the colony PCR test. In this test we also added two extra strains of E. coli in order to have more data for the statistical analysis, the strains used were J13002 and 331 ([http://partsregistry.org/wiki/index.php?title=Part:BBa_K398331 BBa_K398331] in pSB1A2). We followed the same procedure as in the experiment 1, for this experiment we also included a positive control which was cell extracts from a culture of Pseudomonas putida growing on octane as sole carbon source, the cells were inoculated the night before and they were harvested when the O.D. at 600 nm was 0.608; the results obtained were the following:
| kat/mg | U/mg | STDEV | Improvement | T-test | Relative to putida | ||
|---|---|---|---|---|---|---|---|
| E. Coli | 8.75E-12 | 5.25E-04 | 8.18987E-12 | - | - | 0.90% | |
| 018A-2 | 9.30E-12 | 5.58E-04 | 1.84877E-12 | 6.26% | 0.4708 | 0.96% | |
| 018A-3 | 3.05E-11 | 1.83E-03 | 6.27802E-12 | 249.14% | 0.9808 | 3.15% | |
| 018A-4 | 8.26E-12 | 4.96E-04 | 1.8256E-12 | -5.59% | 0.4053 | 0.85% | |
| P. Putida | 9.69E-10 | 5.82E-02 | 2.09109E-10 | - | 0.9883 | 100.00% |
According to these results, the other two strains (018A-2 and 018A-4) do not functionally express the part BBa_K398018. However, these results confirm our findings from the first experiment. You can download our result in this link: File:TUDelft ADH results2.xls You can also find a summary in this file:File:TUDelft ADH summary.xls
Conclusions
According to our results, a normal E. coli cell extract has a dodecanol-1 dehydrogenase activity of 9.64e-12 kat/mg (0.58 mU/mg); whereas our recombinant strain 018A has an activity of 2.93e-11 kat/mg (1.76 mU/mg). According to our analysis, the enzymatic activities of both strains are statistically different at confidence level of 0.95 which means that the part [http://partsregistry.org/Part:BBa_K398018 BBa_K398018] increases 2 times the alcohol dehydrogenase activity in the cell extract. We can conclude from our data that the parts [http://partsregistry.org/Part:BBa_K398005 BBa_K398005] and [http://partsregistry.org/Part:BBa_K398018 BBa_K398018] have biological activity; particularly when we used [http://partsregistry.org/Part:BBa_K398018 BBa_K398018] the enzyme activity of E. coli cell extracts became equivalent to 3% of the in vitro activity of the positive control (Pseudomonas putida). A comparison of both activities maybe it is not interesting from the functional point of view, since those differences could be related to substrate affinity or discrepancies in the optimal pH. However, we think that from this comparison of both in vitro activities we can suggest future teams interested in our part [http://partsregistry.org/Part:BBa_K398005 BBa_K398005] to use a stronger promoter-rbs combination; maybe by increasing the amount of protein produced it is possible to get higher in vitro and in vivo activities. Nevertheless, we have to stress that the in vivo activity of the part [http://partsregistry.org/Part:BBa_K398018 BBa_K398018] is still unknown for us, maybe there is a lack of long-chain alcohol transporter proteins or it is necessary to over-express this part in order to see/measure it.
Characterization of the ALdehyde DeHydrogenase system
Growth on alcohols as sole carbon source
As we described before, we tried to grow our recombinant strains Escherichia coli 029A ([http://partsregistry.org/Part:BBa_K398029 BBa_K398029] on the plasmid pSB1A2) and Escherichia coli 030A ([http://partsregistry.org/Part:BBa_K398030 BBa_K398030] on the plasmid pSB1A2) on Octanal and Dodecanal. No growth was observed after 48 hours. We abandoned this experiment after this result.
Resting cell assays
- We grew 'Escherichia coli 029A, Escherichia coli 030Aand Escherichia coli negative control (Biobrick BBa_J13002 on plasmid pSB1A2 ) in 50 mL of M9 medium with glucose and CAS aminoacids.
- The cells were harevested when the O.D. at 600nm was around 0.3; they were spun down at 4000 rpm, for 10 min at 4ºC. And the resting cell assays were prepared according to the standard protocol
| Strain | O.D. |
| J13002 | 0.327 |
| 029A | 0.340 |
| 030A | 0.330 |
Note: This experiment was run in parallel with the resting cell assays for 018A, the negative control culture of the strain J13002 used was the same for both experiments.
- After an overnight incubation at 37ºC with the substrate (octanal), the organic phase was extracted using 3 mL of ethyl acetate (dodecane was used as internal standard). We tried to determine production of alkanoic acids by Gas Chromatography measurements. The chromatograms are shown below:
- According to our results there was a peak reduction for octanal, however we were worried because of the fact that we didn't see the peak of the product (dodecanoic acid) appearing. It could be that the cells are just storing the product inside the cell. The experiment required to much time in order to get more results: the extractions, preparation of triplicates, cultures, cell suspensions... etc. it was a work that would require an effort of all the team for a couple of weeks. We decided to go for something easier and faster to measure; since we had some experience with the NADH determinations that was our choice.
NADH production in cell extracts
Cells were cultured in 50mL of LB medium and harvested when the O.D. 600nm of the culture was between 0.5-0.8. Two different cultures of each recominant strain and the negative control were prepared.
| Strain | O.D. 600nm |
| J13002 (1) | 0.825 |
| J13002 (2) | 0.774 |
| 029A (1) | 0.746 |
| 029A (2) | 0.753 |
| 030A (1) | 0.532 |
| 030A (2) | 0.532 |
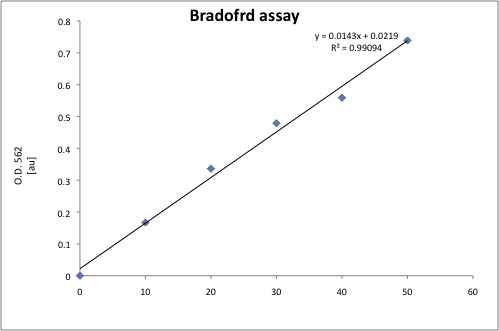
Cytoplasmic proteins were extracted using our standard protocol. And a standard curve for protein quantification was prepared.
The total protein of each sample was quantified using 20uL of cell extract, the results are shown below.
| Total protein [ug] | ug/uL | |
|---|---|---|
| J1300 | 31.108 | 1.555 |
| 029A (1) | 19.974 | 0.999 |
| 030A (1) | 12.610 | 0.630 |
| 029A (2) | 12.854 | 0.782 |
| 030 (2) | 18.578 | 0.929 |
| P. Puitda | 9.783 | 0.489 |
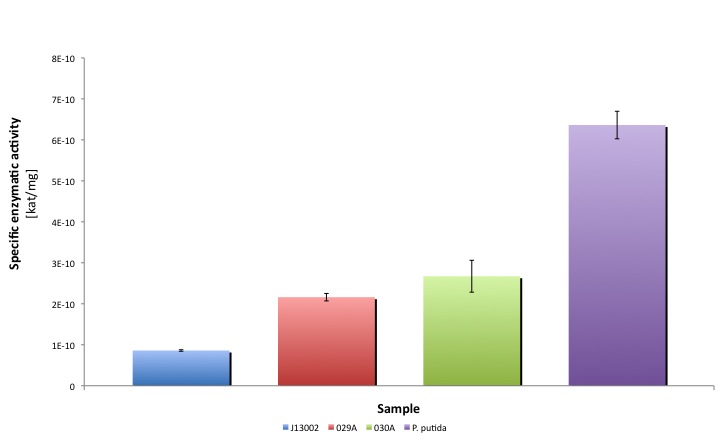
The aldehyde dehydrogenase activity was measured using the standard protocol and Dodecanal as substrate.
After the data treatment, the results that we obtained were the following:
| J13002 | 029A (1) | 029A (2) | 030A (1) | 030A (2) | P. putida | ||
|---|---|---|---|---|---|---|---|
| Specific activity | kat/mg | 8.604E-11 | 1.470E-10 | 2.853E-10 | 2.433E-10 | 2.912E-10 | 6.362E-10 |
| U/mg | 5.162E-03 | 8.820E-03 | 1.712E-02 | 1.460E-02 | 1.747E-02 | 3.817E-02 | |
| Standard deviation | 1.778E-12 | 6.187E-12 | 4.026E-11 | 3.539E-11 | 4.319E-11 | 3.361E-11 | |
| Relative to (J13002) | 100.00% | 170.86% | 331.59% | 282.79% | 338.46% | 739.41% | |
| Relative activity (P. putida) | 13.52% | 23.11% | 44.84% | 38.25% | 45.78% | 100.00% | |
| T-test vs J13002 | - | 0.9827 | 0.9599 | 0.9764 | 0.9976 | 0.9976 | |
| T-test vs P. putida | 0.9999 | 1.0000 | 0.9998 | 0.9974 | 1.0000 | - | |
| Average activity [kat/mg] | 8.604E-11 | 2.161E-10 | 2.673E-10 | 6.362E-10 |
You can download a file with our raw data, results anda summary here: File:TUDelft ALDH results.xls
Conclusion
Our results suggest that the recombinant strains E. coli 029A and E. coli 030A functionally express our biobricks, we couldn't prove in vivo activity. However, it is clear from the statistical analysis performed that the expression of ... under the promoter-rbs combination increases the dodecanal dehydrogenase activity in E. coli cell extracts 2-fold; whereas the expression of the same protein using the part J13002 increases the same activity 3-fold. Moreover, the enzymatic activities measured are equivalent to % and % of the Pseudomonas putida aldehyde dehydrogenase activity.

 "
"
