Team:ETHZ Basel/Modeling/Experimental Design
From 2010.igem.org
Experimental Design
Insights for wet laboratory
Goals of the evaluation
To determine the best network structure for the biological implementation of the E. lemming and the best experimental conditions, the combined molecular model (Light switch - Chemotaxis) has been used to answer specific questions:
- Which protein of the chemotaxis pathway (CheR, CheB, CheY or CheZ) should be fused...
- ...to which light-sensitive protein (PhyB or PIF3)?
- Which aspartate concentration should be used in the experiments?
- Which concentrations of the two synthetic fusion proteins (Che-LSP1, Tet-LSP2) and the DNA binding sites (tetO) result in a high sensitivity of the network on red and far-red light?
Answers to this questions were able to decrease the experimental expenses significantly.
Evaluator
Evaluation of the results is a general optimization problem. The output variable in the case of E. lemming is the concentration of free and phosphorylated CheYp, because it is directly linked to the movement bias. To achieve a reasonable evaluation variable, the relative amplitude of free and phosphorylated CheYp was chosen to be maximized.
Because of the limited amount of different combination possibilities, it was decided to evaluate all combinations. Parameter space of variable experimental implementation possibilities is shown in Table 1.
| Che | LSP1 | LSP2 | [Asp] | [AP] | [anchor] | model |
|---|---|---|---|---|---|---|
| CheR | PhyB | PIF3 | 0 μM | 0 μM | 0 μM | Spiro |
| CheB | PIF3 | PhyB | 10^-6 μM | 25 μM | 25 μM | Mello |
| CheY | 10^-3 μM | 50 μM | 50 μM | |||
| CheZ | 75 μM | 75 μM | ||||
| 100 μM | 100 μM |
The questions were answered in a hierarchical order, e.g. try Che1 before Che2.
Results
1. Which protein of the chemotaxis pathway (CheR, CheB, CheY or CheZ) should be attacked?
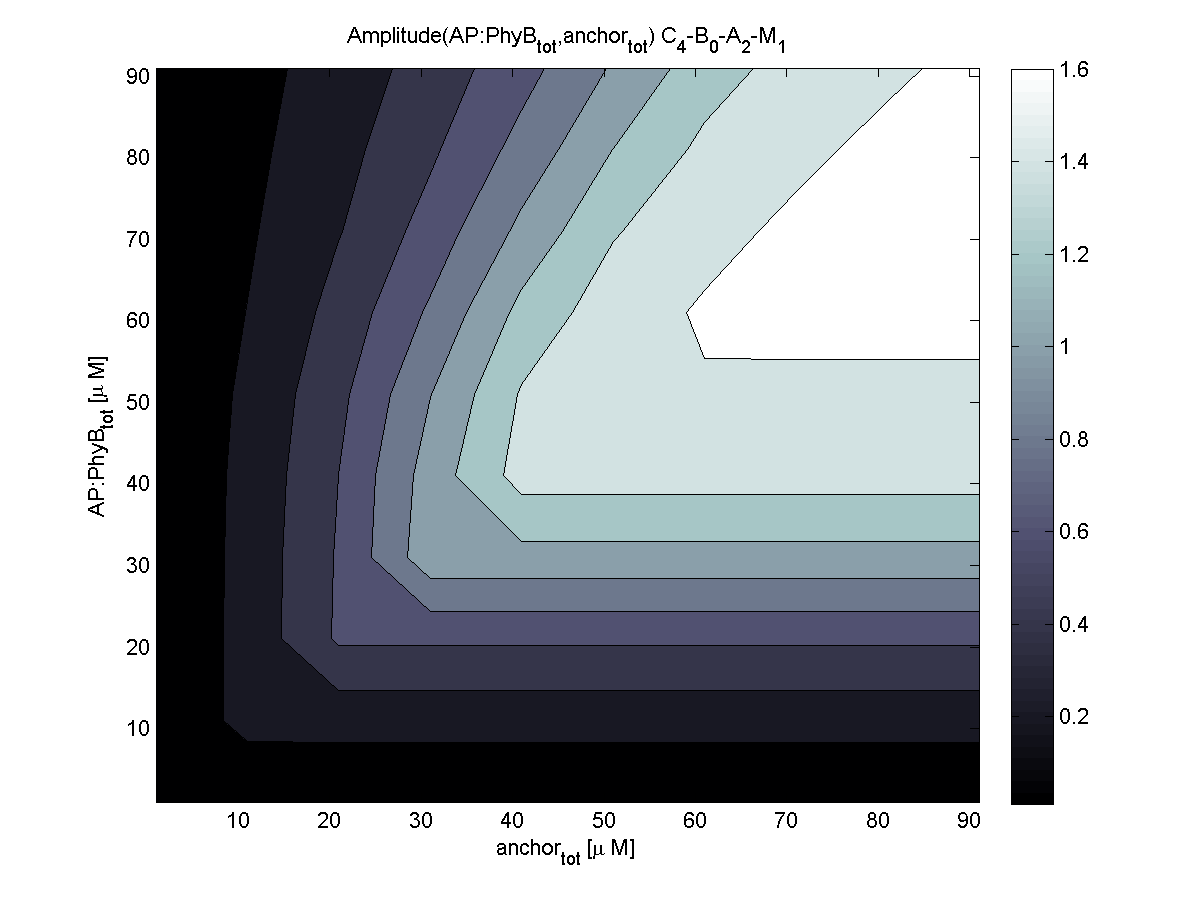
Although CheZ showed the highest relative amplitude, it was not chosen to be the first candidate, since it is located at the cell membrane and therefore, CheY would still be able to dephosphorylate CheZ, because CheY is not strictly spatially located. For this reason, CheY was chosen to be the first target. CheR and CheB would have been possible backup targets in this order.
In addition, CheB and CheZ showed inverse activation / inactivation behavior than CheR and CheY upon light pulse induction. This means, that the activity would increase and therefore, this would have to be corrected by increasing the concentration of the proteins far above wild-type level to achieve an inverse effect of activation.
2. To which light-sensitive protein (PhyB, PIF3) should the Che protein be linked?
PhyB is according to the evaluation the more robust choice compared to PIF3, but it's speculated that PhyB might have the tendency to sequester, since PhyA does under certain conditions. This would result in a lowered active concentration of the species, because the proteins stick together. In addition, PIF3 is much smaller than PhyB and it could therefore have a lower negative influence on the Che protein. Relative amplitude of PIF3 is higher, although at lower levels, it's very similar. For this reasons, PIF3 was the first choice as light-sensitive protein linked to the Che protein.
3. What is a good aspartate concentration?
Aspartate concentration should be chosen to reach saturation or near-saturation of aspartate receptor. In this example, medium aspartate levels were able to reach near-saturation of the receptors and therefore, this parameter value was chosen.
4. In what quantity should the anchor and binding light-sensitive protein be chosen?
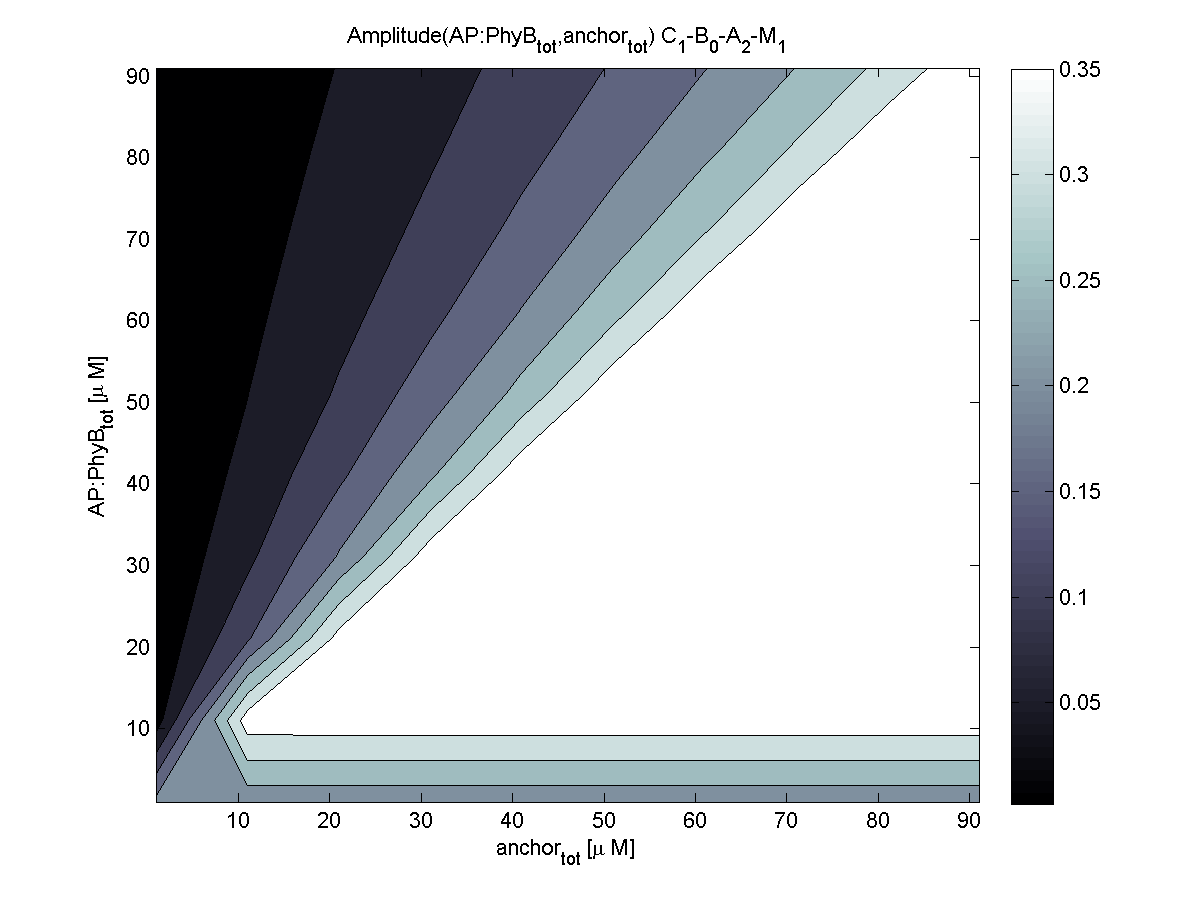
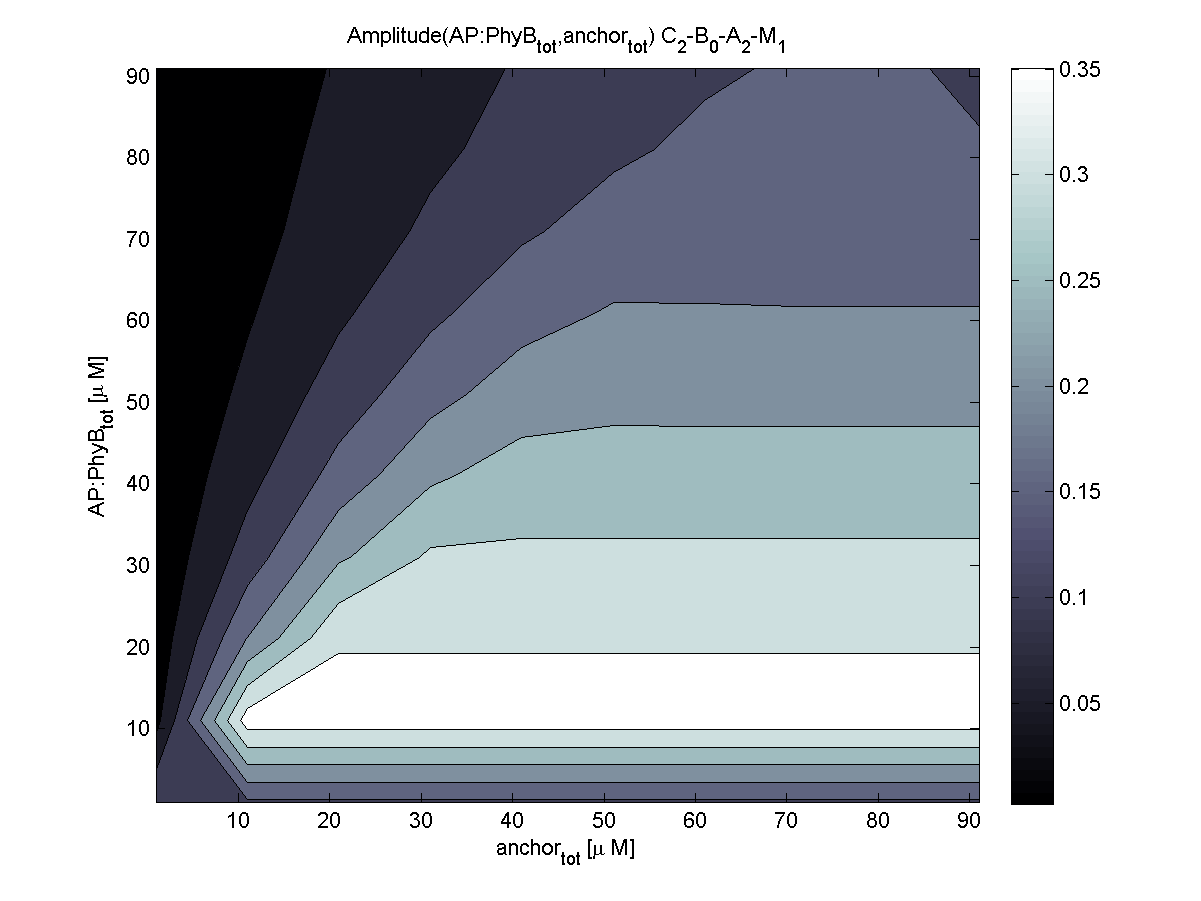
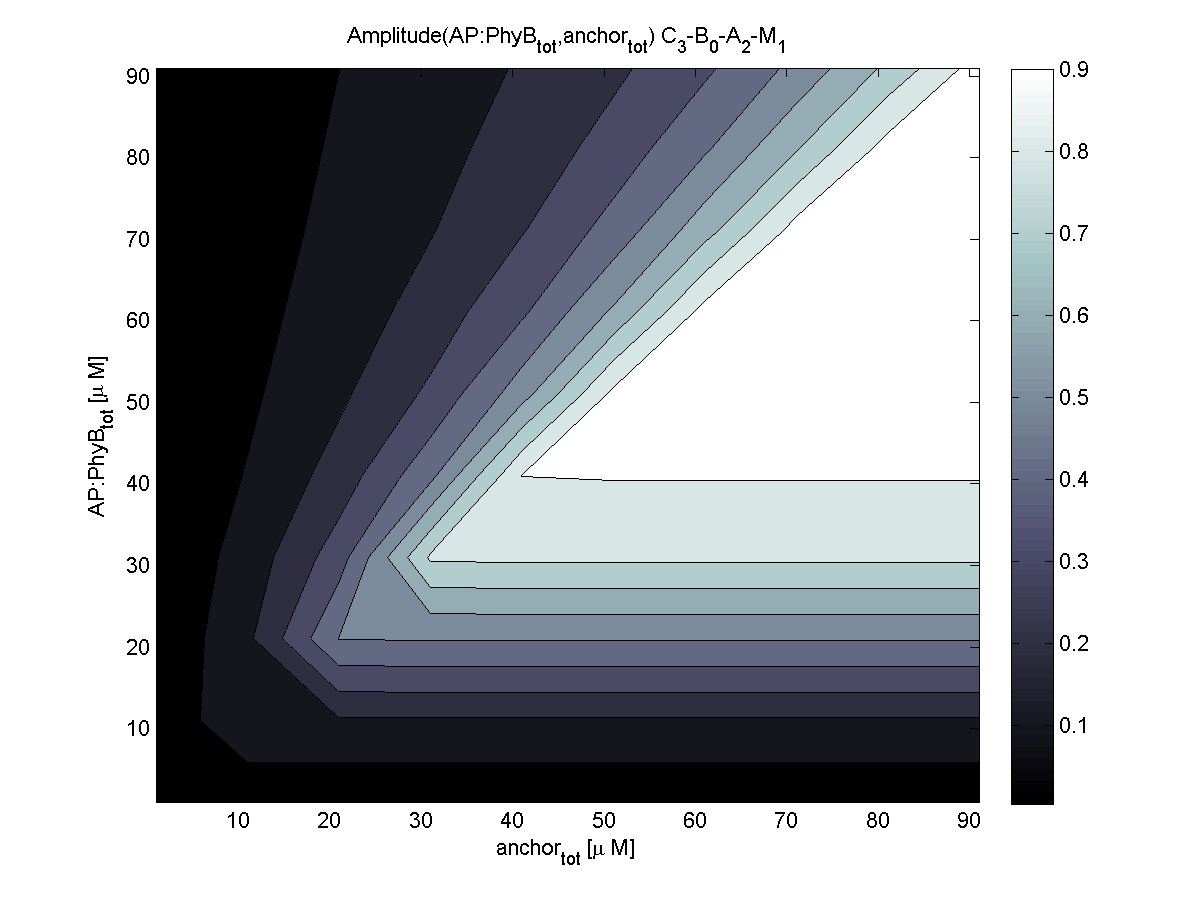
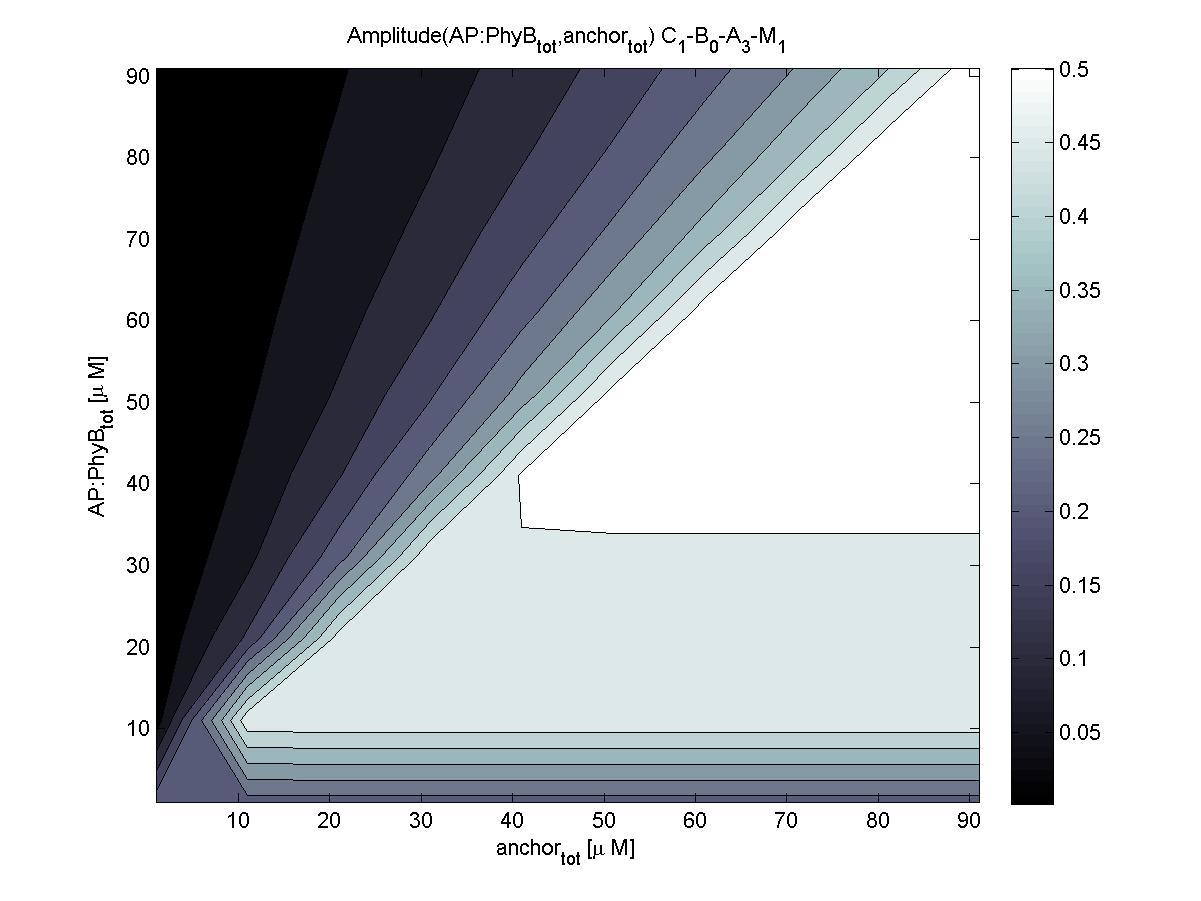
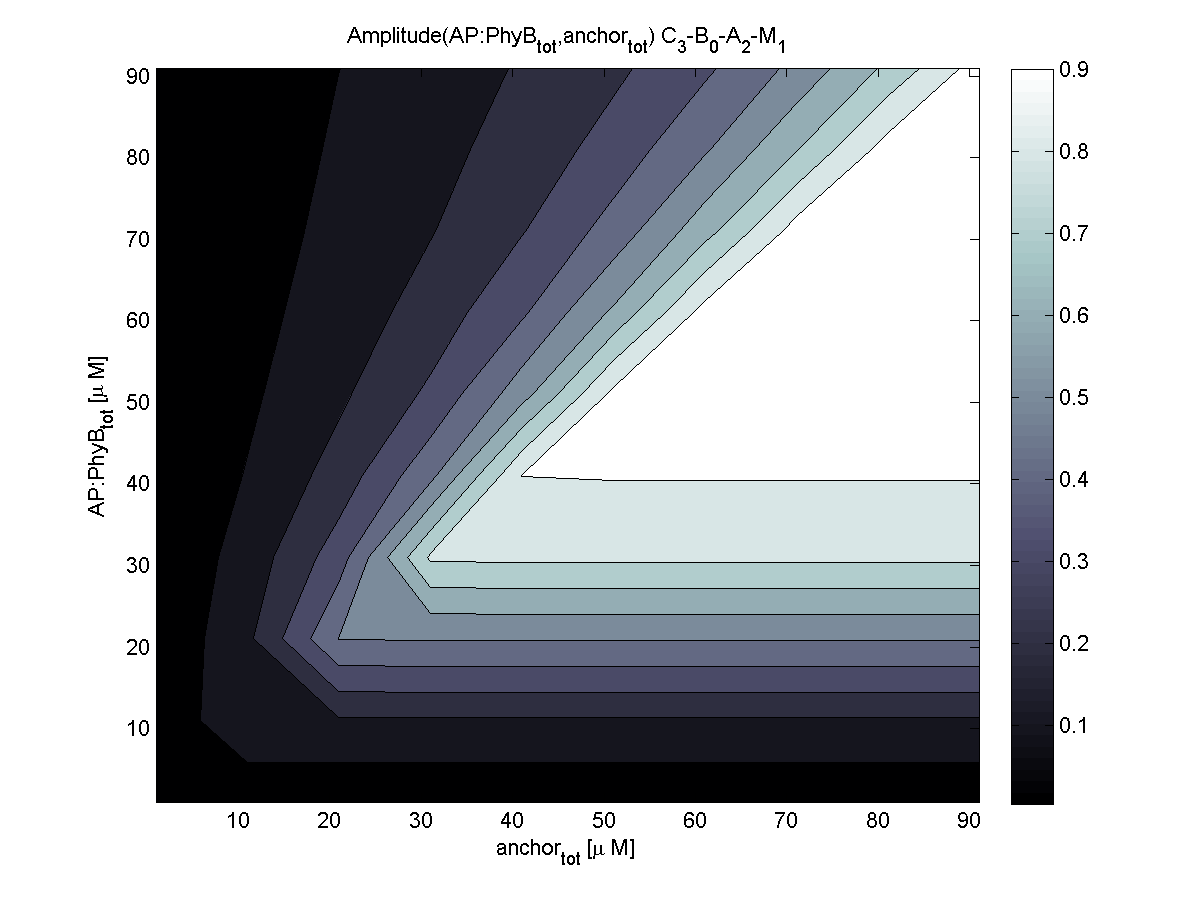
According to the the evaluation of all 48 parameter combination possibilities, it was decided to take a concentration for anchor plasmid of [anchor] = 50 μM and a concentration for the anchor binding protein [AP] = 40 - 50 μM, which is slightly below to ensure having enough binding positions.
Comparison of the chemotaxis models
Both chemotaxis receptor models implemented in the combined model predicted very similar results. An obvious difference is the missing consideration of CheZ in the Mello model.
Insights for information processing
Goal of the evaluation
Main goal of the evaluation for information processing was to determine time constants of far-red light and red light induction and resulting change in E. lemming by using the combined molecular model (Light switch - Chemotaxis). These results are the experimentally optimal light pulse times for the LEDs attached to the controller, as predicted by our molecular model.
Evaluator
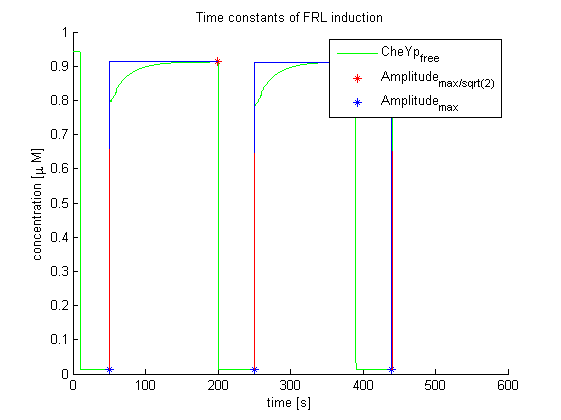
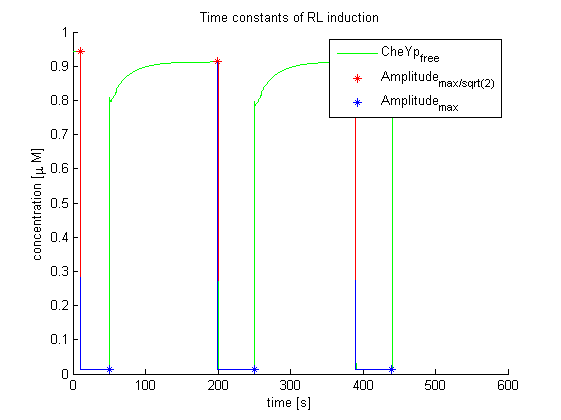
Again, the output variable was the concentration of free and phosphorylated CheYp. To determine the time constants, the time elapsed upon activation of the system until the amplitude reached 2^-(1/2) of the local maximum was measured. Results were determined for our target configuration of E. lemming (CheY, LSP1:PIF3, Asp:Medium).
Results
The similarity of the predictions of both models suggests a time constant around 0.35s. Both plots show knicks (especially the Mello & Tu (2003) prediction) at the time, when the light pulses were turned off. The reason for this is the immediate cut off of species flow in both direction and following re-equilibration of the system. This happens for both red and far-red light pulse induction.
The red light is faster than the far-red light reaction. Nevertheless, the time scale is very similar and the mean of 0.14 seems reasonable.
Evaluation script
The evaluation script can be downloaded from the Achievements/Interworking section.
 "
"


