Team:Johns Hopkins/Modeling
From 2010.igem.org
Contents |
Abstract
The expressed purpose of this model is to take the data obtained through experiment and simulate the actions of saccharomyces cerevisiae at different voltages. The yeasts, in SC complete media, were electroporated at various voltage to induce calcium ion intake through L-type voltage-gated calcium channels. As yeasts have no sarcoplasmic reticulum, calcium will be imported largely from outside the cell. by following precedents set by the Reuter-Stevens (RS) and the Goldman-Hodgkin-Katz (GHK) models, the total charge in calcium imported into the cell during the period of electric stimulation was derived from the current-voltage relationship. The concentration of calcium taken into the cell was derived from the total charge imported, and used to determine the output of yellow fluorescent protein (YFP). the model consists of two major parts: the calculation of calcium intake and the determination of transcription/translation levels induced by calcium. These results fit the data presented in the notebook.
The Voltage-Gated Calcium Channel
Assumptions
- [Ca2+]out is in excess compared to [Ca2+]in.
- The experiment takes place at room temperature (25oC).
- the L-type Ca2+ (Cch1) channel is homologous to those found in other eukaryotes.
- Any Ca2+ that enters into the channel will exit into the cell.
- The channel is specific and selective for Ca2+.
- The cell is at steady state previous to stimulation.
- There are two activation gates ('a') and two inactivation gates ('i').
- Gates of the same type are identical and independent in action.
- There are approximately 100 calcium channels per yeast cell.
Constant Instantiation
the overall model of the calcium channel can be subdivided into its constituent gates: the activation gate and the inactivation gate. Collapsed into chemical formulas, the channel's interactions with the calcium can be thought of as such:
Based off the assumption that any bound calcium must travel inside, the result:
These may be further subdivided into the activation and the inactivation gates:
The rate constants are provided below:
The Calculation of Voltage Experienced at the Cellular Level
Although the electrodes registered voltages in volts, the individual changes felt by the individual cells in the SC media are estimated to be in millivolts. In particular, a recursive algorithm was used to calculate the optimal voltage wherein charge (from calcium) transport across the membrane occurred at the greatest rate. The MATLAB function fsolve was utilized to find this point. It reflects the observed data as seen in the notebook: the optimal point was found to exist at roughly 0.007-0.008 V, or 7-8 mV.
Calculation of Charge Intake
The charge intake is usually dependent on two variables: stimulation time and stimulation voltage (received). The dependence can be reduced to one variable by varying the stimulation voltage at fixed stimulation times. Simultaneously, it is useful to construct, as per the RS model, a relationship between the calcium current and membrane voltage, at various stimulation times. From Ohm’s Law, it is known that V = IR. Therefore, the equation may also be written as:
In this case, the current would consist solely of calcium ions moving into the cell. Also, it is required that the term GV be scaled by the probability of the channel being open, and also by the number of channels per cell. Thus, current may be written as:
or,
The Nernst Potential of calcium can be considered to be roughly 123 mV, under physiological conditions. exists as the probability that both inactivation gates and both activation gates are open. Therefore, may be modeled as such:
Bear in mind that this, as is the RS model, is a stochastic model. By calculating the steady state values of and from the differential equations:
And
At steady state, or and ,
The solution of the differential equations above takes the form:
Therefore, the current may be written as:
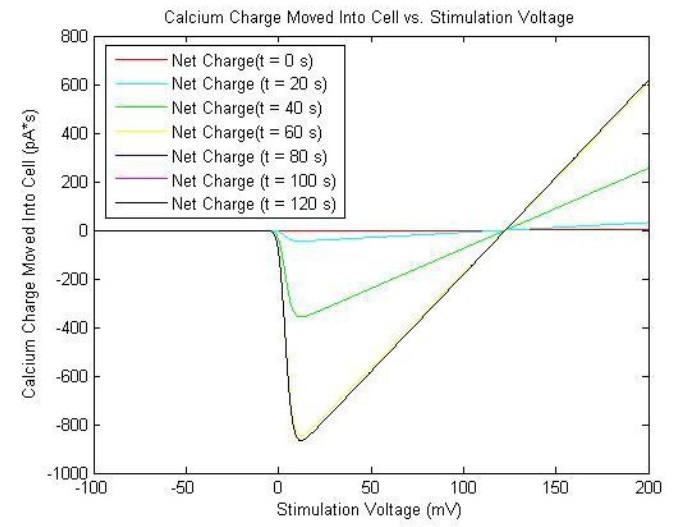
The solutions are plotted as such:
The reason that the current is negative is that by convention, the inward diffusion of calcium ions is called inward current, since it diffuses into the cell. Therefore, one must remember to take the negative of the current to obtain its magnitude. The relatively small magnitudes of and render the channel relatively insensitive to inactivation, and as such, the action is mitigated by negative feedback from the calcium binding to calmodulin and calcineurin. This will be discussed further in the Calcium-Induced YFP Transcription/Translation.
Derivation of Calcium Intake and Post-Stimulation Calcium Concentration
The amount of calcium taken into the cell, and therefore the post-stimulation concentration, can be derived from the current taken at the ideal stimulation voltage (8 mV), during the ideal shock time (60 s). The idea behind the equation is simple: the total instantaneous charge will be taken, divided by 2x elementary charge, then divided by Avogadro’s number to obtain the number of moles taken in. This is then divided by the volume of the cell (1.25e-13 L) to obtain the post-stimulation concentration.
This concentration of calcium will be the input from which YFP transcription is derived.
Calcium-Induced YFP Transcription/Translation=
Assumptions
- Entry into the nucleus occurs by diffusion, on the scale of several minutes.
- YFP takes more than a day to significantly degrade.
- Calcium first binds to Calmodulin; it is assumed that all of this bound calcium will bind to Calcineurin.
- The cells used are diploid yeast cells.
Constant Instantiation
| Ca = 33.14; | |
| Cn = .00033; | %mM |
| kf = 0.000083333333; | %(mM*s)^-1 |
| kb = 0.083333333; | %s^-1 |
| kc2 = -0.0000006; | %(mM*s)^-1 |
| Crz1pP = 0.1; | %mM |
| kd = 0.4; | %s^-1 |
| ke = 0.1; | %s^-1 |
| Pi = 0.03; | %mM |
| kc1 = -0.00018; | %(mM*s)^-1 |
| Pomo = 0.415144; | %s^-1 |
| kg = 0.5; | %s^-1 |
| kh = 0.00053; | %s^-1 |
| ktranscrip = 0.03; | %s^-1 |
| kdegm = 0.000757; | %s^-1 |
| ktransl = 0.18; | %s^-1 |
| kdegp = 0.0000115741; | %s^-1 |
Setup of the System and Solution (YFP concentration)
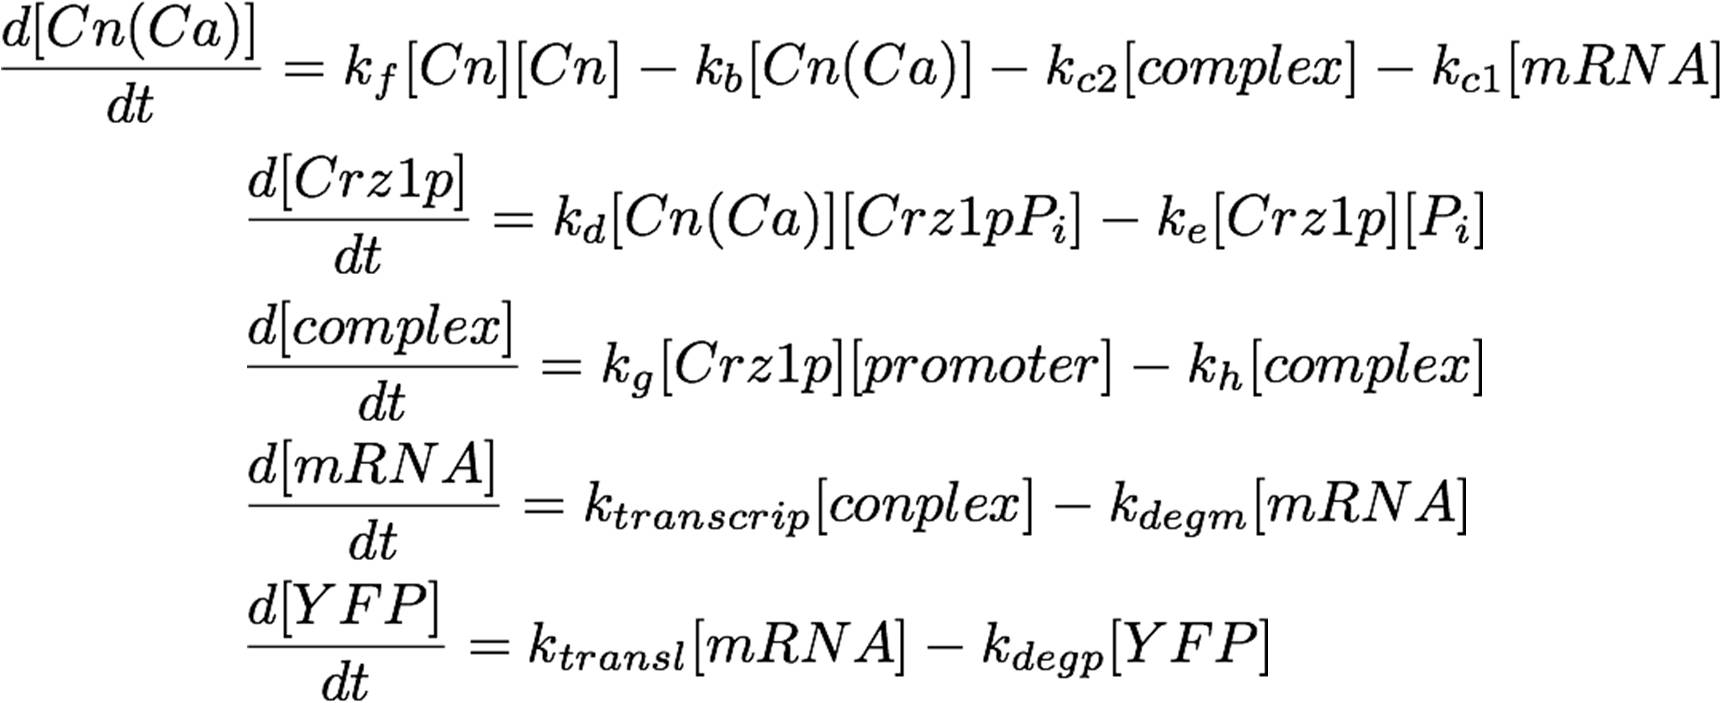
The system as pictured in the abstract can be represented as a system of differential equations:
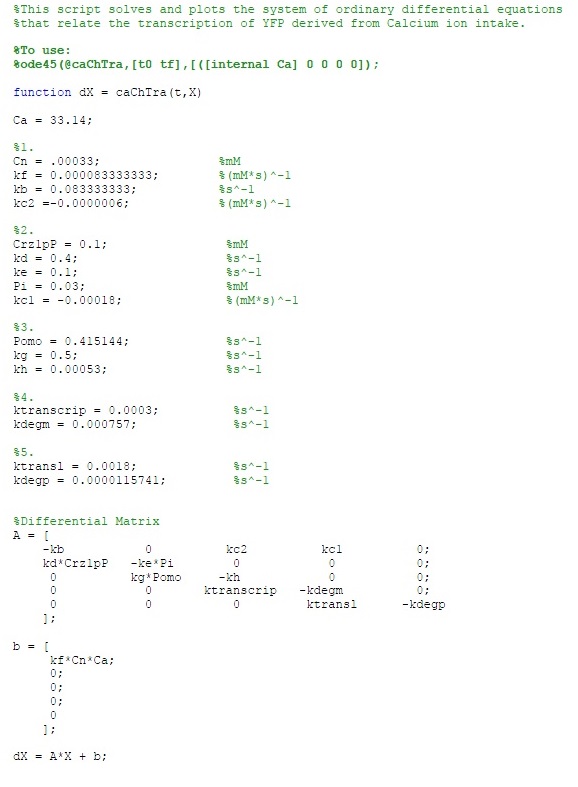
This equation can easily be placed in vector-matrix form, which can be solved numerically by MATLAB. Observe:
The MATLAB code is as follows:
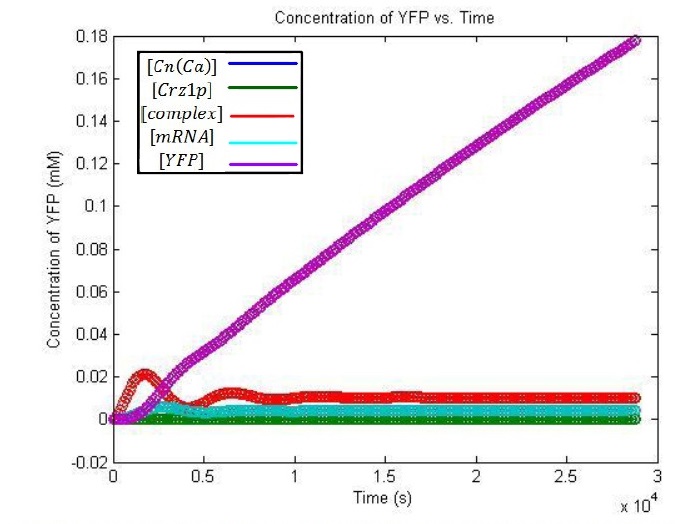
The solution of the problem:
From this graph, it is evident that the YFP concentration will grow to detectable levels by the time it is imaged, 3-8 hours later. The linearly increasing portion of the YFP concentration curve will taper off and decrease after a day or so, once degradation begins to take effect.
 "
"


