Team:TU Delft/Project/rbs-characterization/results
From 2010.igem.org
The RBS strength defines how much of a protein is produced compared to a reference RBS sequence. However, RBS characterization measurements only include current protein level (GFP measurements) and current biomass concentration (Absorption measurements). During measurements, the protein concentration is also influenced by other factors:
- The rapid growth of the bacteria will dilute the protein considerably
- Proteins degrade over time.
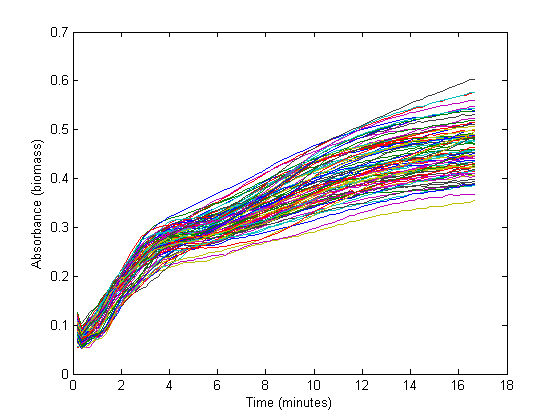
From the biomass, or optical density (OD), graph below, it can be seen that the fastest growth occurs from 50 minutes until about 3 hours into the experiment. Within this timespan, it is assumed that growth is exponential, and growth rate can be calculated. The graph below shows 72 growth curves. 12 seperate wells were used for every RBS sequence.
We are using a very simple protein production model that assumes a constant production in within the exponential part of the growth curve.
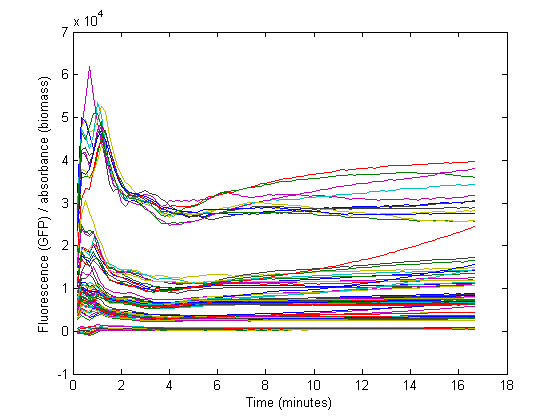
This is fitted against the specific GFP concentration below (GFP divided by absorbance data):
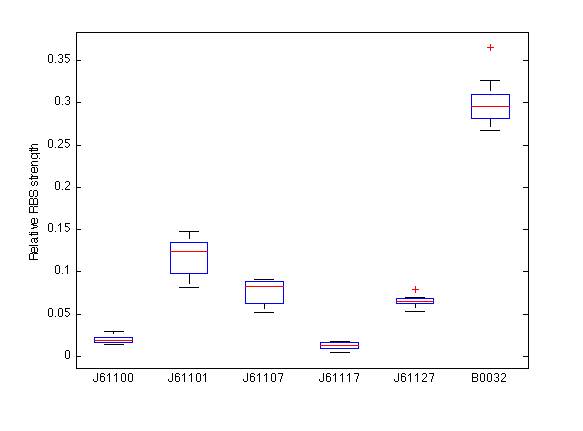
The resulting production rates (Beta from the model), are plotted in the boxplot below:
The given relative strengths are displayed assuming B0034 as the unit.
| RBS | Mean strength | Standard deviation |
| J61100 | 0.026560 | 0.005126 |
| J61117 | 0.123819 | 0.024725 |
| J61101 | 0.081210 | 0.013402 |
| J61107 | 0.019763 | 0.003963 |
| J61127 | 0.069657 | 0.007422 |
| B0032 | 0.300000 | 0.028316 |
 "
"


