Team:UT-Tokyo/Sudoku modeling
From 2010.igem.org


Sudoku
4C3leak switch
We modeled our 4C3 leak switch as deterministic ODE system.
Modelling
Assumption
1.We treated DNA as continuous variable, since there could be hundreds of plasmid in one E.coli (multicopy plasmid). There are 32 kinds of variables that stand for DNA concentration corresponding to their different internal states.
2.We assumed that cre recombinase operate as tetramer, and other recombinase as dimer (but this seems not to be relevant).
3.We assumed that association and dissociation of DNA recombinase to DNA is sufficiently fast so that equilibrate in the timescale of the whole switch.
4.We ignored the reverse reaction of DNA recombinase because we used irreversible sequence (lox66, lox71 etc).
Variable
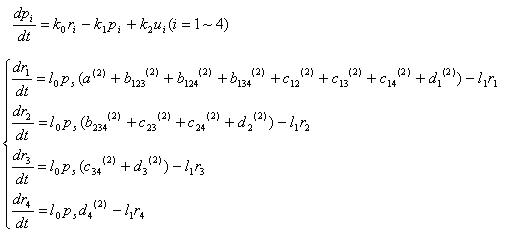
Basically, "pn" denotes protein concentration and "rn" denotes mRNA concentration
p1,p2,p3,p4 : concentration of 4 recombinase protein
r1,r2,r3,r4 : concentration of 4 recombinass mRNA
u1,u2,u3,u4 : concentration of input mRNA
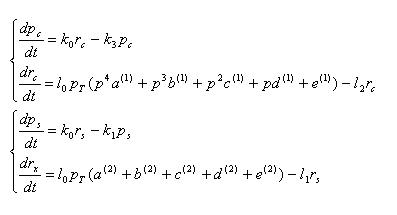
pc,rc : concentration of cre recombinase protein and mRNA
ps,rs : concentration of SP6 polymerase protein and mRNA
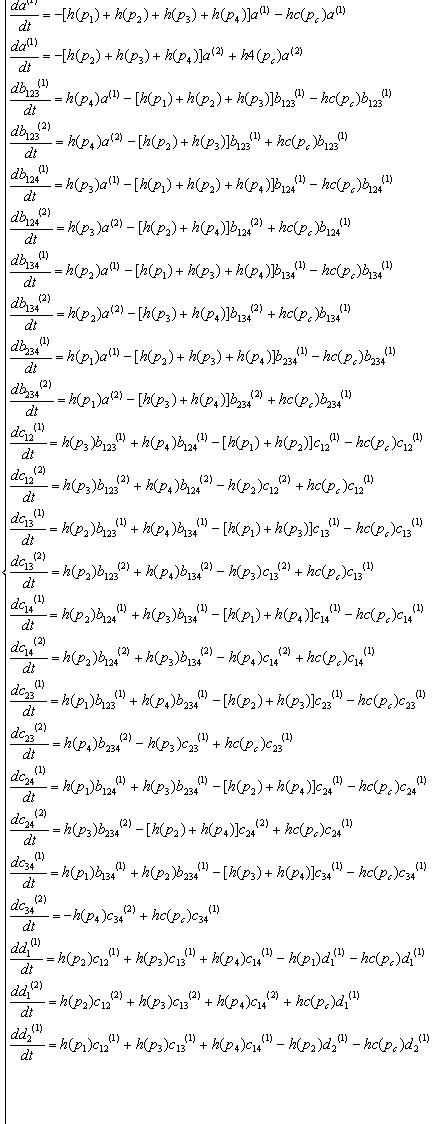
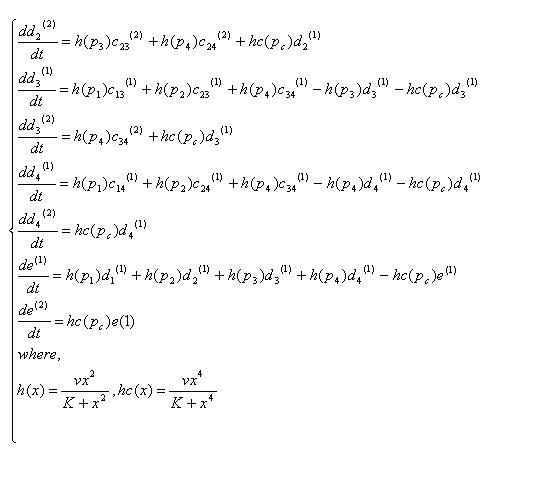
Variables that denote concentration of DNA in each state. "a","b","c","d","e" means there are four,three,two,one,zero recombinases in the DNA, respectively. And the subscripts specify which recobinases remain, while the numbers in bracket mean whether the DNA has been cut by cre recombinase( (1) has not been cut, (2) has been cut).
| all | 123 | 124 | 134 | 234 | |
| not cut by cre | a(1) | b123(1) | b124(1) | b134(1) | b234(1) |
| cut by cre | a(2) | b123(2) | b124(2) | b134(2) | b234(2) |
| 12 | 13 | 14 | 23 | 24 | 34 | 1 | 2 | 3 | 4 | none |
| c12(1) | c13(1) | c14(1) | c23(1) | c24(1) | c34(1) | d1(1) | d2(1) | d3(1) | d4(1) | e(1) |
| c12(2) | c13(2) | c14(2) | c23(2) | c24(2) | c34(2) | d1(2) | d2(2) | d3(2) | d4(2) | e(2) |
Parameters
k0 : mRNA translation rate
k1 : protein degradation rate
k2 : mRNA translation rate
k3 : cre protein degradation rate
l0 : transcription speed per unit concentration of RNA polymearase
l1 : mRNA degradation rate
l2 : cre mRNA degradation rate
K : recombinase binding constant
v : recombinase reaction rate
pT7 : concentration o T7 polymerase
p : terminator leak probability
Equations
Methods
We used our original python program (4 th order explicit Runge-Kutta algorithm) to solve thess equations.
Results
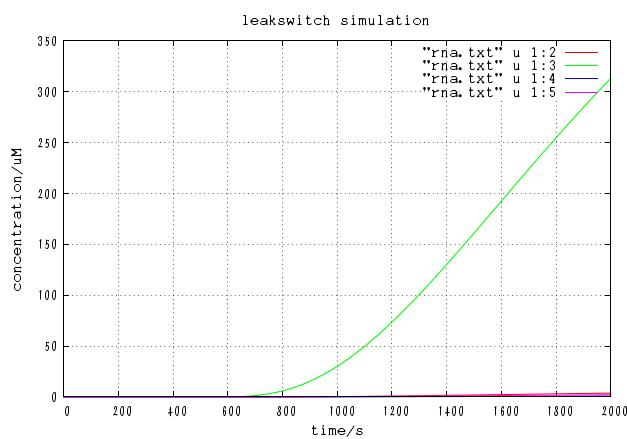
We input signal 1,2,4 and simulated the time evolution of the system.
The time course of DNA concentration
The time course of mRNA concentration. Note that the output of this system is not protein but mRNA.
Discussion
It is confirmed that the system works as expected with a certain combination of parameters.
In addition, we changed many parameters, especially,l0,v(whose values are unclear) and p(leakiness of terminator) , to see whether the device is able to operate within a large part of parameter space.
Although increasing p basically increases the concentration of correct output mRNA, it also increases incorrect mRNA. On the other hand, decreasing p generally decreases both the concentration of correct mRNA and incorrect mRNA. Besides, too low value of p cannot leads to failure operation because cre protein concentration cannot get high enough. Careful test have shown that there is certain value of p that [correct mRNA]/[incorrect mRNA] takes maximum value. In this case, the optimal value is approximately p = 0.001 and the ratio is 10^(-6).
Changing the value of v and l0 doesn't affect the function of the circuits qualitatively although it changed the time the systems takes to reach steady state.
As a result, the circuit can function correctly within the range of 0.001< p < 0.1, 0.001 < v <1.0, 0.01 < l0 < 1.0 , demonstrating its robustness. This robustness may come from the assumption that DNA recombination is irreversible, which is supported by our design of the system.
conclusion
The correct operation of the switch was confirmed. By changing parameter exponentially, the robustness of the system was shown.
A indifferent sudoku cell simulation
including MS2 phage infection-------
We made a model for a indifferent sudoku cell.
We traverse the amount of phages and see wether the cell react properly against given signals.
Modeling
Variable
U: uninfected coli
I: coli which got '1' signal
Io1: other once infected coli
I2: coli which got '12' signal
Io2: other second infected coli
I3: coli which got '123' signal
Io3: other third infected coli
B4: '4' coli which began phage making
Bo: other coli which began phage making
P4: free phage of '4'
Po: other free phage
S1: signal virus with information of number '1' which come from other sudoku cell
S2: signal virus with information of number '2' which come from other sudoku cell
S3: signal virus with information of number '3' which come from other sudoku cell
S4: signal virus with information of number '4' which come from other sudoku cell
Parameters
g: growth rate of coli
k1: rate of infection
k2: death rate of uninfected
k3: lysis rate of infected
k4: rate of phage producing
k5: phage death rate
k6: terminator leak rate
Arbitrary parameters we can change are
* k1(rate of infection) : k1 relates to the specificity of antisenseRNA.
* k4(rate of phage producing) : k4 relates to the strength of promoter.
* k6(terminator leak rate) : k6 express terminator leak.
We change these parameters, and confirmed its effect.
Equations
We assume that cell lysis caused by MS2 phage is sufficiently rapid than coli death rate.
Method
We used original matlab program.
We set conditions as following.
-when t = 10(min), signal of number '1' comes.(step input)
-when t = 30(min), signal of number '2' comes.(step input)
-when t = 50(min), signal of number '3' comes.(step input)
Results
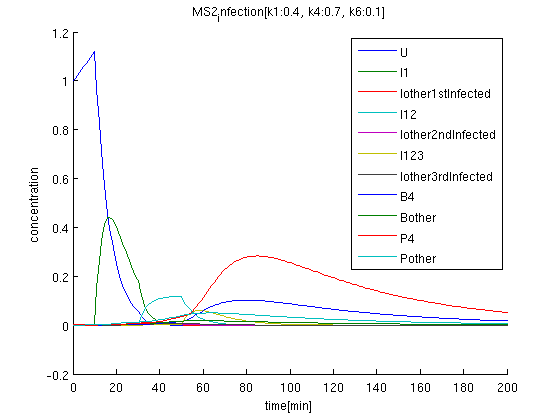
The initial condition of uninfected coli concentration is set to be 1, and observed time evolution.
brue(U): initial concentration is 1. After got signal '1', it decrease suddenly.
green: I1 begins increasing after getting first signal '1'.
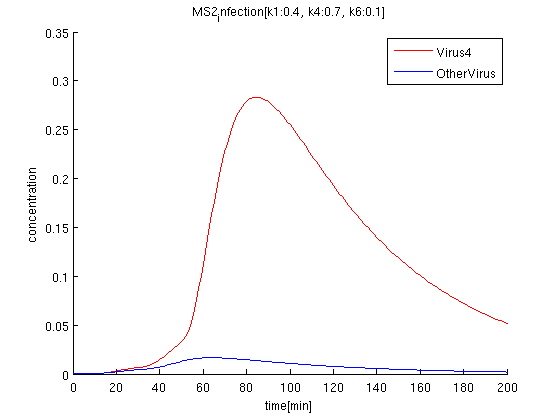
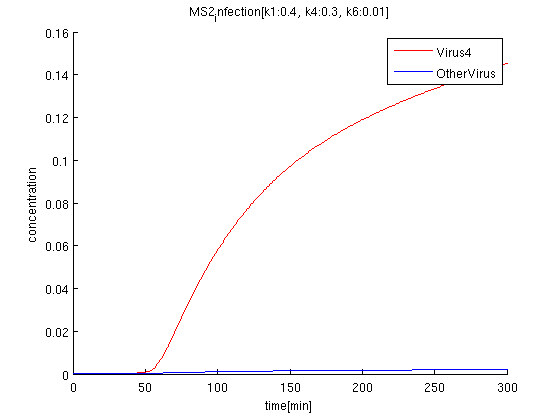
k1:0.4, k4:0.7, k6:0.1 red: The time course of virus concentration which has the information of number '4'.
blue: The time course of virus concentration which has the information of number '1'or'2'or'3'.
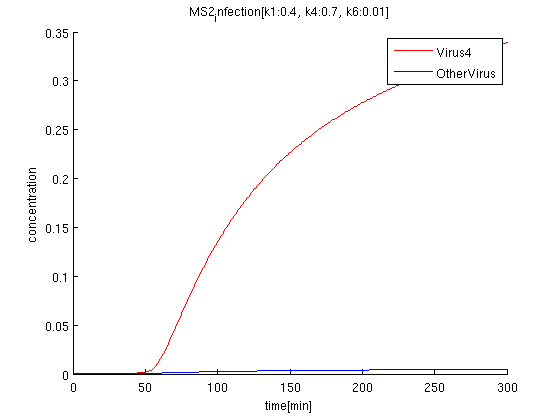
k1:0.4, k4:0.7, k6:0.01
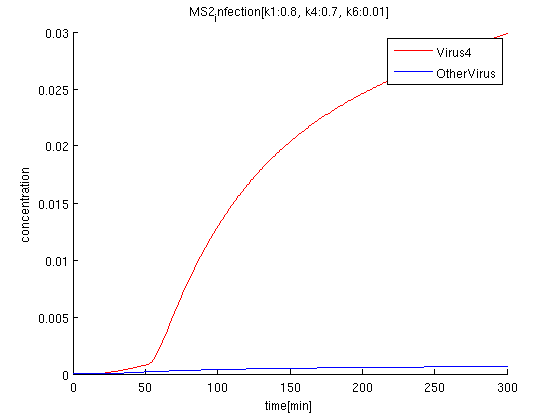
red: The time course of virus concentration which has the information of number '4'.
blue: The time course of virus concentration which has the information of number '1'or'2'or'3'.
As terminator leak rate is less than the previous trial, it takes longer time to start increasing. the concentration of Virus '4' clearly increases comparing to others.
k1:0.4, k4:0.1, k6:0.01
k1:0.8, k4:0.7, k6:0.01
Discussion & Conclusion
It is confirmed that when one cell get '123'signals in order, the cell differentiate into '4'.
The rate of infection(k1) corresponds to antisense RNA specificity. Intuitively, when k1 is too high, coli become sensitive to not only target signals but also wrong signal. Our simulation also indicate when k1 becomes higher, the concentration of Virus'4' decrease.
The rate of phage producing(k4) corresponds to the strength of promoter. If promoter is too strong, the amount of the phage increase but it also raise terminator leak. However in our simulation, the effect to the rate of terminator leak error is lower.
The rate of terminator leak relates to the time of the differentiation, and the accuracy of the signal. According to the simulation, we can see the clear difference between Pharge'4' and other Pharge'123'in 100-300 minutes, when the terminator leak rate is around 0.01.
 "
"

