Team:TU Delft/Modeling/protein-production-model
From 2010.igem.org
Protein production model
https://2010.igem.org/Team:TU_Delft#page=Project/rbs-characterization
Previous models
We've noticed that previous teams have performed their protein expression rate analysis to only include current protein level (fluorescence measurements) and current biomass concentration (absorption measurements). However, we've found that during measurements, the protein concentration is also influenced by other factors:
- The rapid growth of the bacteria dilutes the protein considerably
- Proteins degrade over time.
See below for more on how we approached these issues.
Growth curve fitting
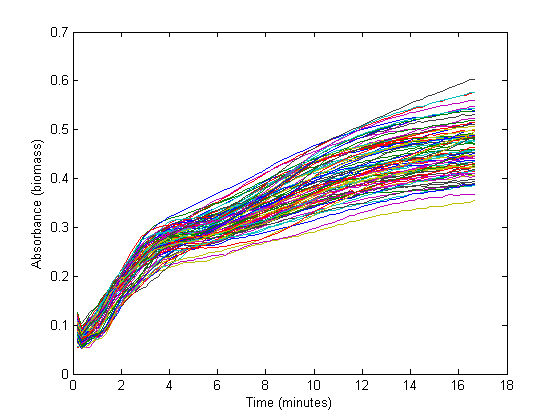
From the biomass, or optical density (OD), graph below, it could be concluded that the fastest growth occurs from 1 hour to 3 hours into the experiment. Within this timespan, it is assumed that growth is exponential, and growth rate can be calculated. The graph below shows 72 growth curves. All in all 12 wells were inoculated per strain carrying a different RBS sequence or 'empty' plasmid (I13401).
The exponential section of this graph was thus curve-fitted to an exponential growth model:
Which resulted in a growth rate ('mu') which was implemented in the dilution factor in the further calculations.
Biomass growth will dilute GFP
The conventional method for characterization of RBS or promotor sequences is to assume that the derivative of the GFP fluorescence is equal to the production rate, as shown in the formula from Kelly et al [1].

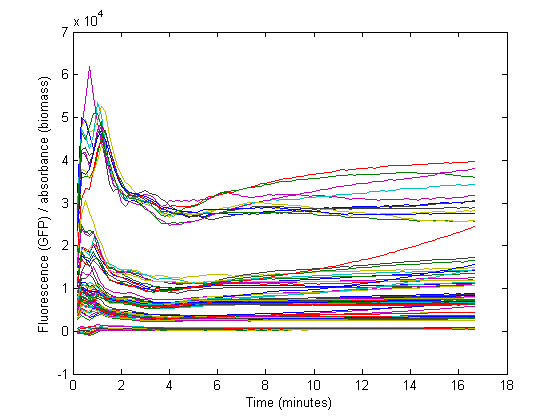
However, this method would only be representable if the strains are subcultured multiple times from the exponential phase. In that case, a steady state GFP concentration (fluorescence) may be assumed and dilution is ignored. Due to the decrease in the biomass specific GFP fluorescence at the start of the measurements it was assumed that dilution effects played an important role in our data and thus was taken into account for our model.
Protein production model
As discussed earlier, the protein production model will take dilution into account. Furthermore, the GFP protein used used is stable (half life 41 hours), thus the degradation term is negligible compared to dilution. These assumptions call forth the following formulas:
where:
- Y is the GFP concentration
- Beta is the production rate (the constant that we're interested in)
- Alpha is the sum of the dilution rate and the degradation rate
Converting this equation into an explicit form results in:
The 2 unknown parameters (beta and Y1) could now be curve-fitted against the biomass specific GFP data, using the lsqcurvefit command found in MatLab. The beta constants for each of the 72 wells were then determined and compared to the reference RBS BBa-B0032 to yield the relative RBS strengths listed in the results page.
Source code and data
https://static.igem.org/mediawiki/2010/8/88/TUDelft_2010_RBS_characterization.zip
References
[1] Jason R. Kelly, Adam J. Rubin, Joseph H. Davis, et al (March 2009). "[http://dx.doi.org/10.1186/1754-1611-3-4 Measuring the activity of BioBrick promoters using an in vivo reference standard]". Journal of Biological Engineering 3: 4
 "
"


