Team:Kyoto/Project/Goal B
From 2010.igem.org
Contents |
Goal B: Characterization of λ Lysis cassette
Introduction
λ Lysis cassette is a gene that causes cell lysis. In previous iGEM, some teams evaluated the lytic activity of λ Lysis cassette qualitatively. However, when we considered λ Lysis cassette not only as a device of cell lysis but as a device of cell death, we must study about λ Lysis cassette more quantitatively. For example, we must study about when cells die, how many cells die, and the relationship between them and the activity of its promoter.
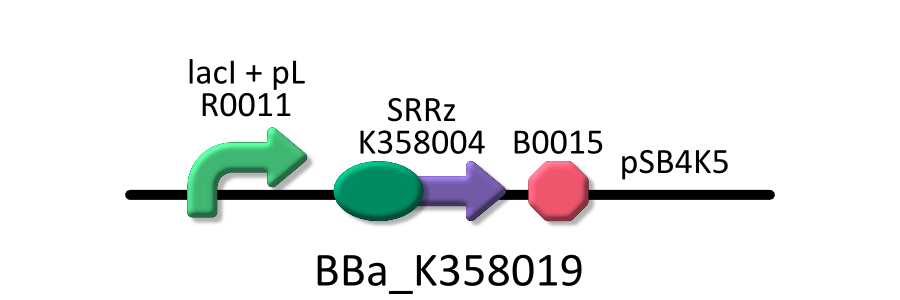
To characterize the lytic activity of Λ Lysis cassette quantitatively, we regulate the gene expression of λ Lysis cassette by a lactose promoter, R0011, which we characterized quantitatively by RPU in GoalA. To repress the basal expression of λ Lysis cassette without IPTG as possible, we used pSB4K5, a low copy vector, as a plasmid backbone and used KRX as a host cell. Needless to say, we characterized R0011 in the same experimental condition. For more detailed explanation of R0011, go Goal A.
Result
Experiment 1: Measurement of lytic activity of λ lysis cassette
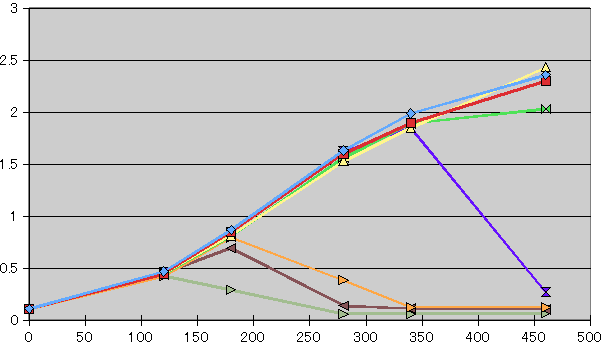
To characterize the lytic activity of λ lysis cassette quantitatively, we had to made a measurement standared of cell lysis quantitatively. We considered that we could characterize it by mesuring A550 of the cultures after induction of IPTG.However, we did't know the nature of it, so we couln't decide when we measured A550 after induction which had a quantitative. As we did some experiences, we earned some facts by try and error.
- Cultures induced the expression of λ lysis cassette becomes a kind of equilibrium state of cell lysis.
- R0011 is very easy to have mutation at 37 degrees if it regulates an expression of toxic gene because of natural selection.
- The possibility of mutation become low at 30 degrees, although it still remains a little.
Therefore, we made the following protocol that is suitable to our motivation.
- Pick out three colonies transformed with K and cultivated in suppemented M9 media with various concentration of IPTG. After incubation of 16h,18h,20h, measure A550 of each culture.
We did the experiment as this protocol, we got the following data.
| Incubating | 16h | 18h | 20h | 16h | 18h | 20h | 16h | 18h | 20h |
|---|---|---|---|---|---|---|---|---|---|
| Colony Number | 1 | 1 | 1 | 2 | 2 | 2 | 3 | 3 | 3 |
| 0mM | 2.13 | 2.17 | 2.35 | 2.05 | 2.04 | 2.14 | 2.22 | 2.21 | 2.33 |
| 0.01mM | 2.02 | 2.01 | 2.15 | 1.96 | 2.23 | 2.23 | 2.21 | 2.07 | 2.29 |
| 0.02mM | 2.21 | 2.12 | 2.16 | 1.86 | 1.86 | 1.95 | 1.76 | 1.93 | 1.71 |
| 0.03mM | 1.44 | 1.41 | 1.39 | 1.70 | 1.62 | 1.59 | 0.82 | 1.02 | 0.83 |
| 0.05mM | 0.33 | 0.25 | 0.17 | 0.25 | 0.25 | 0.24 | 0.26 | 0.33 | 0.24 |
| 0.07mM | 0.15 | 0.17 | 0.23 | 0.21 | 0.20 | 0.23 | 0.18 | 0.18 | 0.19 |
| 0.1mM | 0.13 | 0.20 | 0.36 | 0.20 | 0.18 | 0.23 | 0.17 | 0.15 | 0.23 |
| 0.3mM | 0.10 | 0.21 | 0.31 | 0.08 | 0.11 | 0.14 | 0.11 | 0.07 | 0.20 |
| 0.5mM | 0.07 | 0.08 | 0.10 | 0.08 | 0.08 | 0.09 | 0.11 | 0.08 | 0.25 |
| 0.8mM | 0.25 | 0.10 | 0.08 | 0.29 | 0.22 | 0.11 | 0.18 | 0.22 | 0.10 |
| 1.0mM | 0.04 | 0.15 | 0.21 | 0.18 | 0.27 | 0.27 | 0.18 | 0.06 | 0.24 |
Table 1 A550 of each culture incubated 16h, 18h, 20h, in various concentration of IPTG.
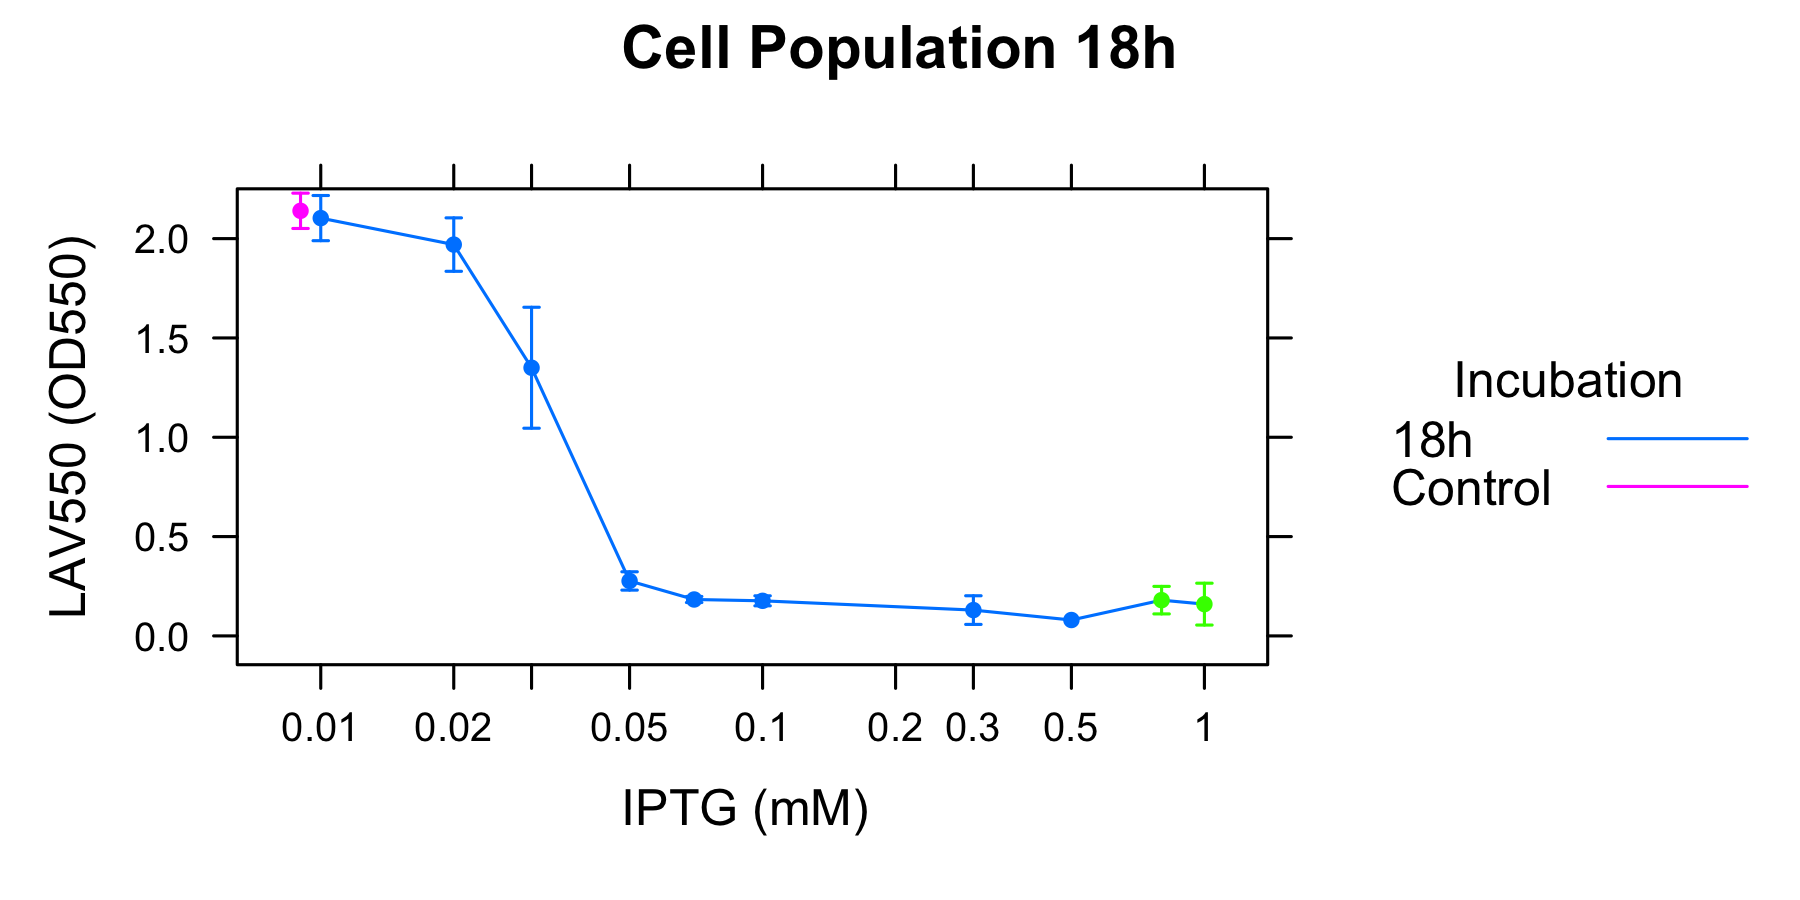
As Table1 shows, the culture surely gets to an equilibrium state of cell lysis depending on the cocentration of IPTG, and we considered that the number of A550 have a quantitative of lytic activity. We adapted to the data of 18h.

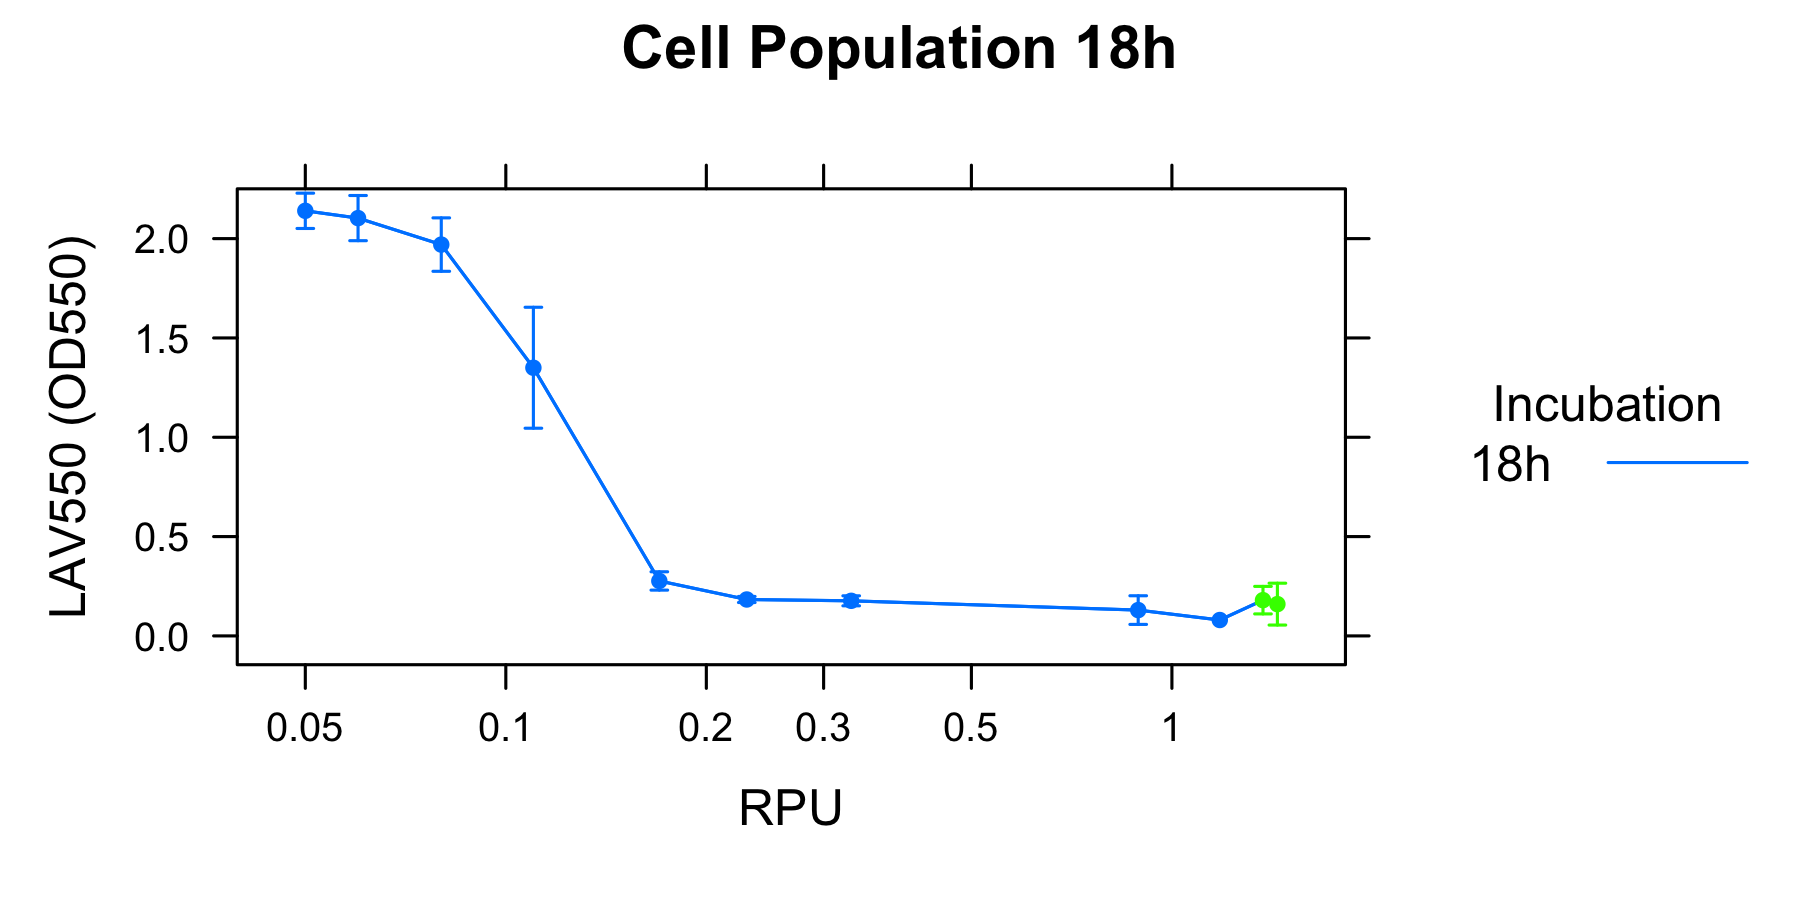
To analyze the relationship between the lytic activity of λ lysis cassette and RPU, we used the result of characterization of R0011.

As a result, when the activity of induction is under RPU, K358019 doesn't work and cell lysis doesn't occur. When the activity of cell lysis is from RPU to RPU, k358019 works and cell lysis gets to an equibrium state. As the activity of induction becomes higher, the cell population of this equibrium state becomes lower. When the activity of induction is over RPU, the equibrium state stop to become low and doesn't seem to change largly though the activity of induction become very high.
Experiment 2: Measurement of lytic activity focusing on the initiation of cell lysis
Discussion
Equilibrium state of cell lysis
From the result of our experiment, we think that cell lysis caused by λ Lysis cassette has an equilibrim state depending on the actibity of induction. This idea can adapt to under 0.2 RPU. However, Over 0.2RPU, the lytic activity doesn't change largely. To explain this phenomena, we make three ideas.
1 カルチャーの中である細胞死のサイクルが起きている 2 The limit which endolyshin can degrade peptideglycan exists 3 詳しくはモデルで
Possibility of a system controlling cell populatiuon
Cell lysis caused by λ Lysis cassette becomes an equilibrium state depending on the induction. This fact suggests another potential of λ Lysis cassette, a system controlling cell population. We make a gene circuit that expresses λ Lysis cassette consutitutively or inducibly, and E.coli transformed with the circuit get to an equilibrium state of cell lysis and the cell population is a specific number. By changing the strength of expression, we can controll this state as we want.
Checkpoint of whether cell lysis occurs
We characterized λ Lysis cassette quantitatively with RPU. From our data, we determined acondition of activity of promoters, if you want to make inducible sysytems of cell lysis by using them. The condition is that: the minimam activity is under RPU and the maximamactivity is over 0.2 RPU. Promoters that fit this condition could use the regulation of λ Lysis cassette.
Initiation of cell lysis
References
1 2 3
 "
"


