Team:TU Delft/Project/rbs-characterization/results
From 2010.igem.org

The Results
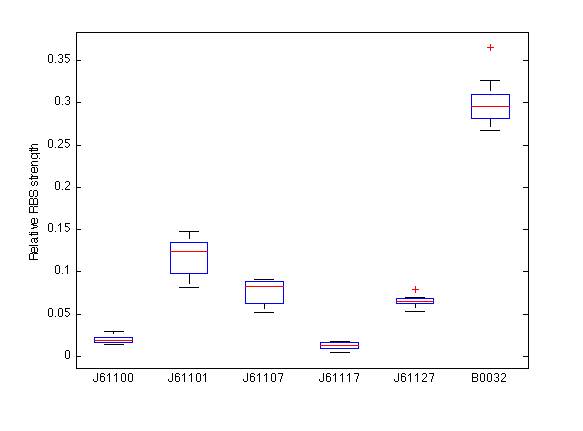
In the boxplot below the RBS strengths for the five tested members of the Anderson family are given along with the deviations from the mean. The strengths are given relative to the community RBS BBa_B0034, which has a strength of unity (1). This relationship could be built by our characterization of the community RBS [http://partsregistry.org/Part:BBa_B0032 BBa_B0032] simultaneously, which is known to have a strength (or efficiency) of 0.3 relative to [http://partsregistry.org/Part:BBa_B0032 BBa_B0034]. Therefore in the plot below, the mean value of BBa_B0032 is fixed at 0.3.
Conclusions
We've succeeded in characterizing five memebers of the Anderson ribosome binding site family by simple culturing while measuring GFP fluorescence and biomass absorbance. Fitting the obtained data to our improved protein production model yielded RBS strengths values with negligible standard deviations. To recap the following RBS strengths (efficiencies) were found:
| Ribosome binding site | Mean relative strength | Standard deviation |
| [http://partsregistry.org/Part:BBa_J61100 J61100] | 0.020 (2.0%) | 0.00512 |
| [http://partsregistry.org/Part:BBa_J61101 J61101] | 0.119 (11.9%) | 0.02140 |
| [http://partsregistry.org/Part:BBa_J61107 J61107] | 0.077 (7.7%) | 0.01480 |
| [http://partsregistry.org/Part:BBa_J61117 J61117] | 0.013 (1.3%) | 0.00448 |
| [http://partsregistry.org/Part:BBa_J61127 J61127] | 0.065 (6.5%) | 0.00660 |
| [http://partsregistry.org/Part:BBa_B0032 B0032] | 0.300 (Reference, 30%) | 0.02690 |

 "
"
