Team:BCCS-Bristol/Wetlab/0-10mM Assay
From 2010.igem.org
iGEM 2010
Contents |
Characterising the Biobrick
With our biobrick made, we then needed to establish whether it worked, and over what range. We began by checking simply whether it responded to nitrate at all. Then, having determined that it did, conducted a more detailed assay across the range of nitrate levels for which the biobrick is most sensitive.
Having established the biobrick was definitely switched on by 20mM of KNO3, we wanted to conduct a broader test of its behaviour across a range of different nitrate levels
Does it work? Yes!
To begin with we simply wanted to determine whether the biobrick worked as expected - producing GFP in the presence of nitrates, but not without.
Two 5mL overnights were set up, one without any nitrogen and one with 20mM of Potassium Nitrate KNO3, made up according to the table below. This level was chosen as previous work by the Edinburgh 2009 iGEM team had shown the promoter strongly active by this point.
| Nitrate (mM) | LB (mL) | KNO3 (μL) |
| 0 | 5 | 0 |
| 20 | 5 | 102 |
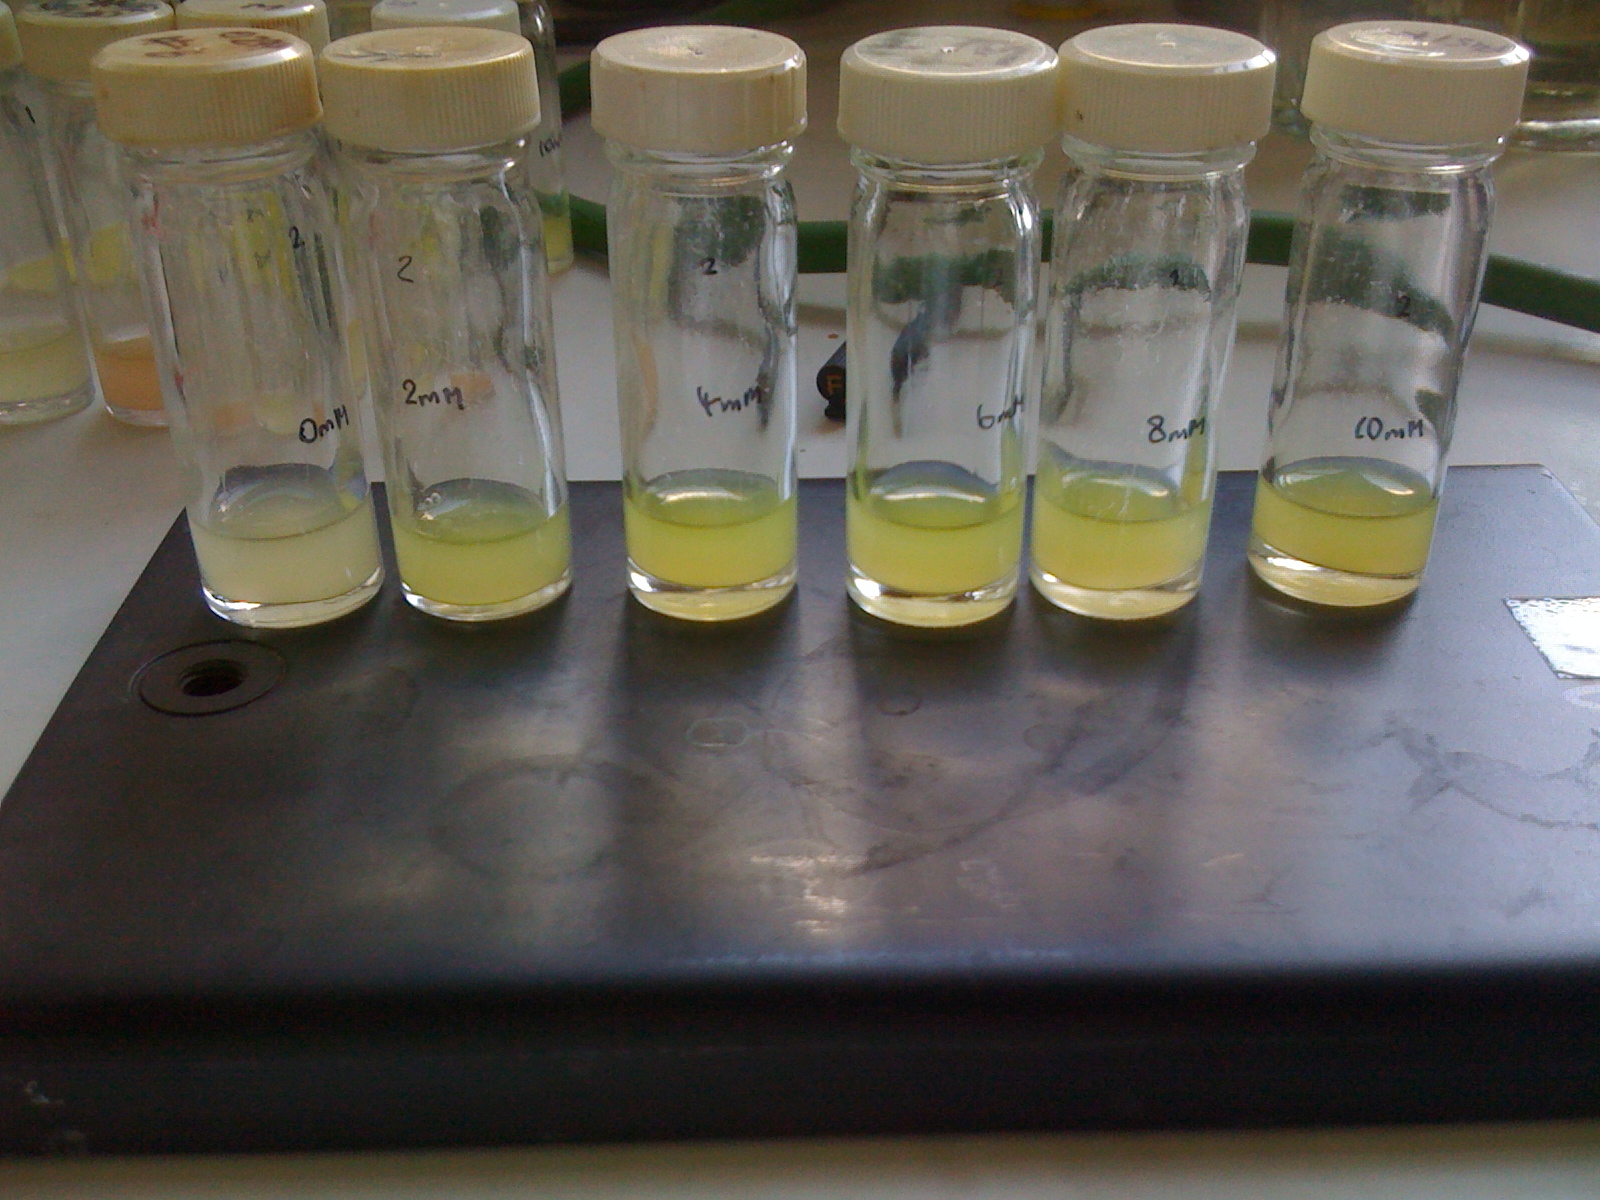
The cultures were then left in the 37°C shaker overnight and examined the next morning. We were pleased to note that the culture exposed to nitrate was visibly green whilst the one without was not, suggesting our new biobrick worked at least at the most basic ‘on/ off’ level.
More detailed characterisation: 0 - 10mM assay
Our next step was to set up and assay examining the biobrick's behaviour between 0 – 10 mM of Potassium Nitrate at 2mM intervals. The same colony of MG1655 containing BBa_K381001 was used to inoculate six 5mL tubes of LB at varying nitrate levels as listed below. This was repeated twice to allow the results to be averaged.
| Nitrate (mM) | LB (mL) | KNO3 (μL) |
| 0 | 5 | 0 |
| 2 | 5 | 10 |
| 4 | 5 | 20 |
| 6 | 5 | 30 |
| 8 | 5 | 40 |
| 10 | 5 | 50 |
Results
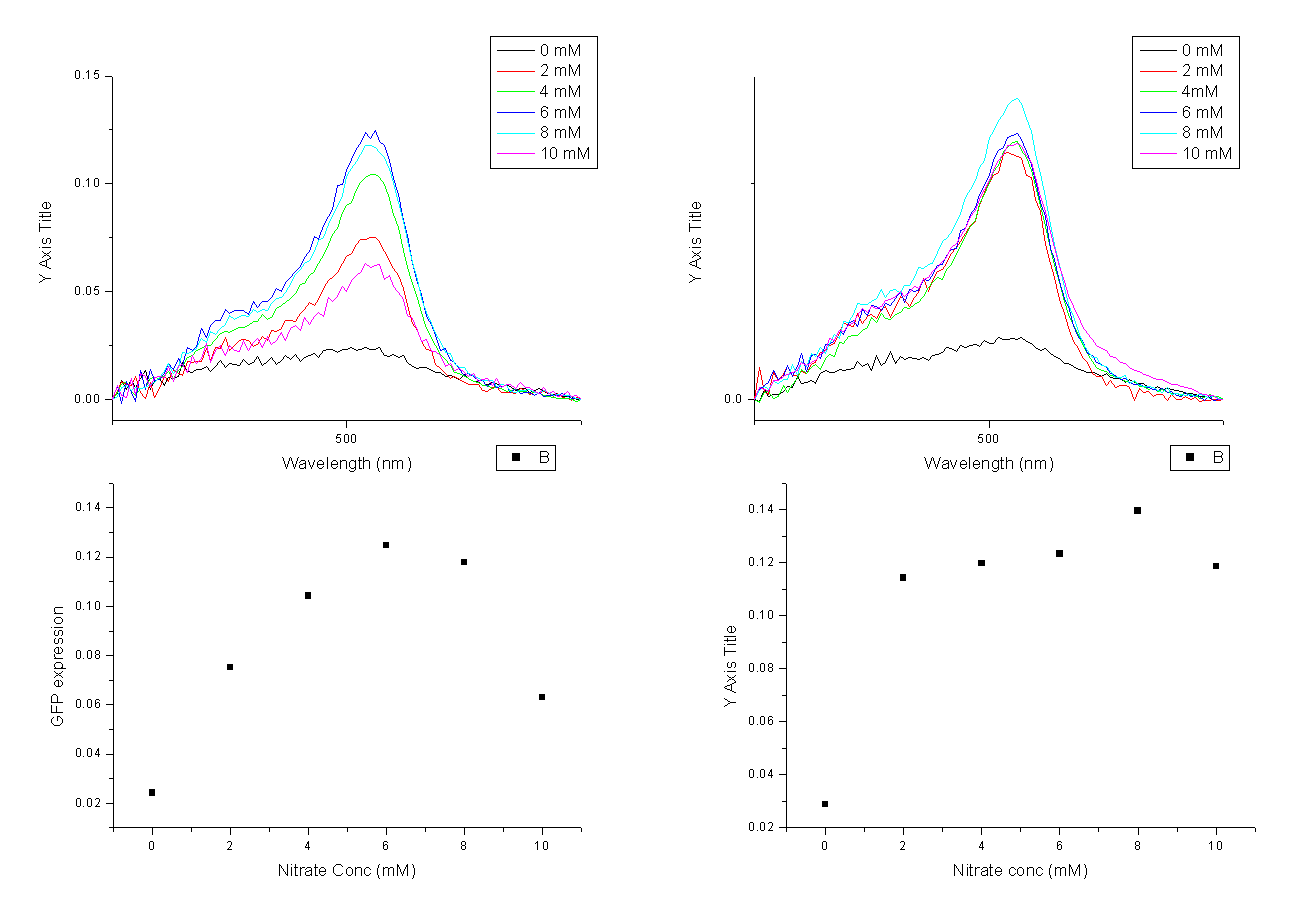
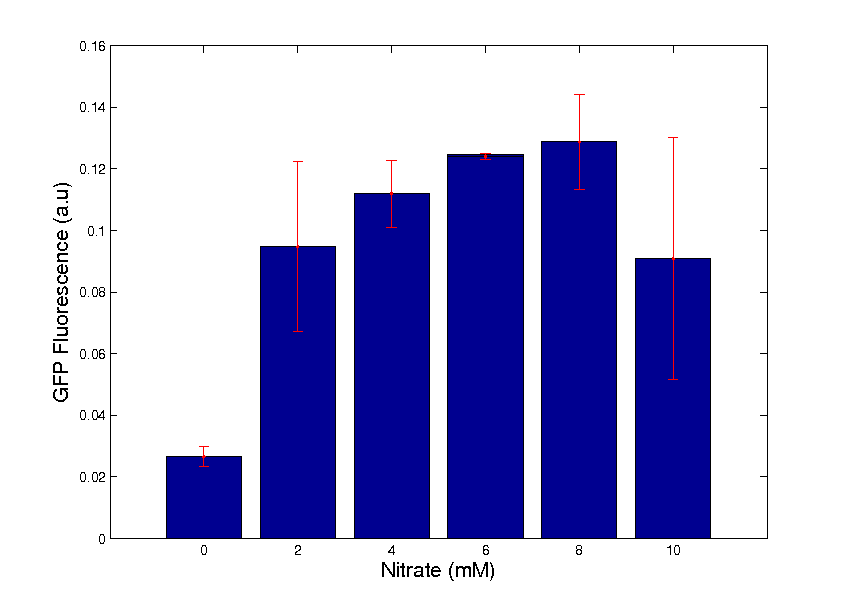
As can be seen in fig. 1, the level of GFP increased steadily with nitrate, with the exact figures in table 1.
| Nitrate (mM) | GFP level test 1 | GFP level test 2 | Average GFP level |
| 0 | 0.0242 | 0.0289 | 0.0266 |
| 2 | 0.0752 | 0.1143 | 0.0948 |
| 4 | 0.1042 | 0.1197 | 0.1120 |
| 6 | 0.1248 | 0.1234 | 0.1241 |
| 8 | 0.1179 | 0.1396 | 0.1288 |
| 10 | 0.0631 | 0.1186 | 0.0909 |
The images below show the data from each repeat, along with the graphs constructed from it. Finally the third graph shows the average trend in GFP increase with nitrate.
Average:
Unfortunately, because we only ran two repeats, we cannot be certain whether the downward curve of the graph is true behaviour or the result of one the 10mM readings being extremely low
 "
"


