Team:SDU-Denmark/labnotes8
From 2010.igem.org
Lab notes (8/30 - 9/5)
Flagella
Since the previous FlhDCmut was wrongly mutated due to incorrect mutation primers, we are now back to square one with new correct primers. The next weeks the flagella-group are working according to the following plan:
1) Miniprep of plasmids with "wrong" FlhDCmut
2) Two-step PCR to get mutatet FlhDC
3) Cut and Ligate into pSB1C3 and pSB1AK3 and transform into TOP10 cells
4) Send to sequencing
5) Characterize biobrick
Miniprep of "wrong" FlhDCmut
Done by: Louise
Date: September 3rd
Protocol: [MP1.2]
Notes:
No changes of protocol were made.
Results:
Nanodrop after sample was dried down:
Sample 1: Concentration: 192ng/ul Purity: 1.96/1.90
Sample 2: Concentration: 200ng/ul Purity: 1.84/1.88
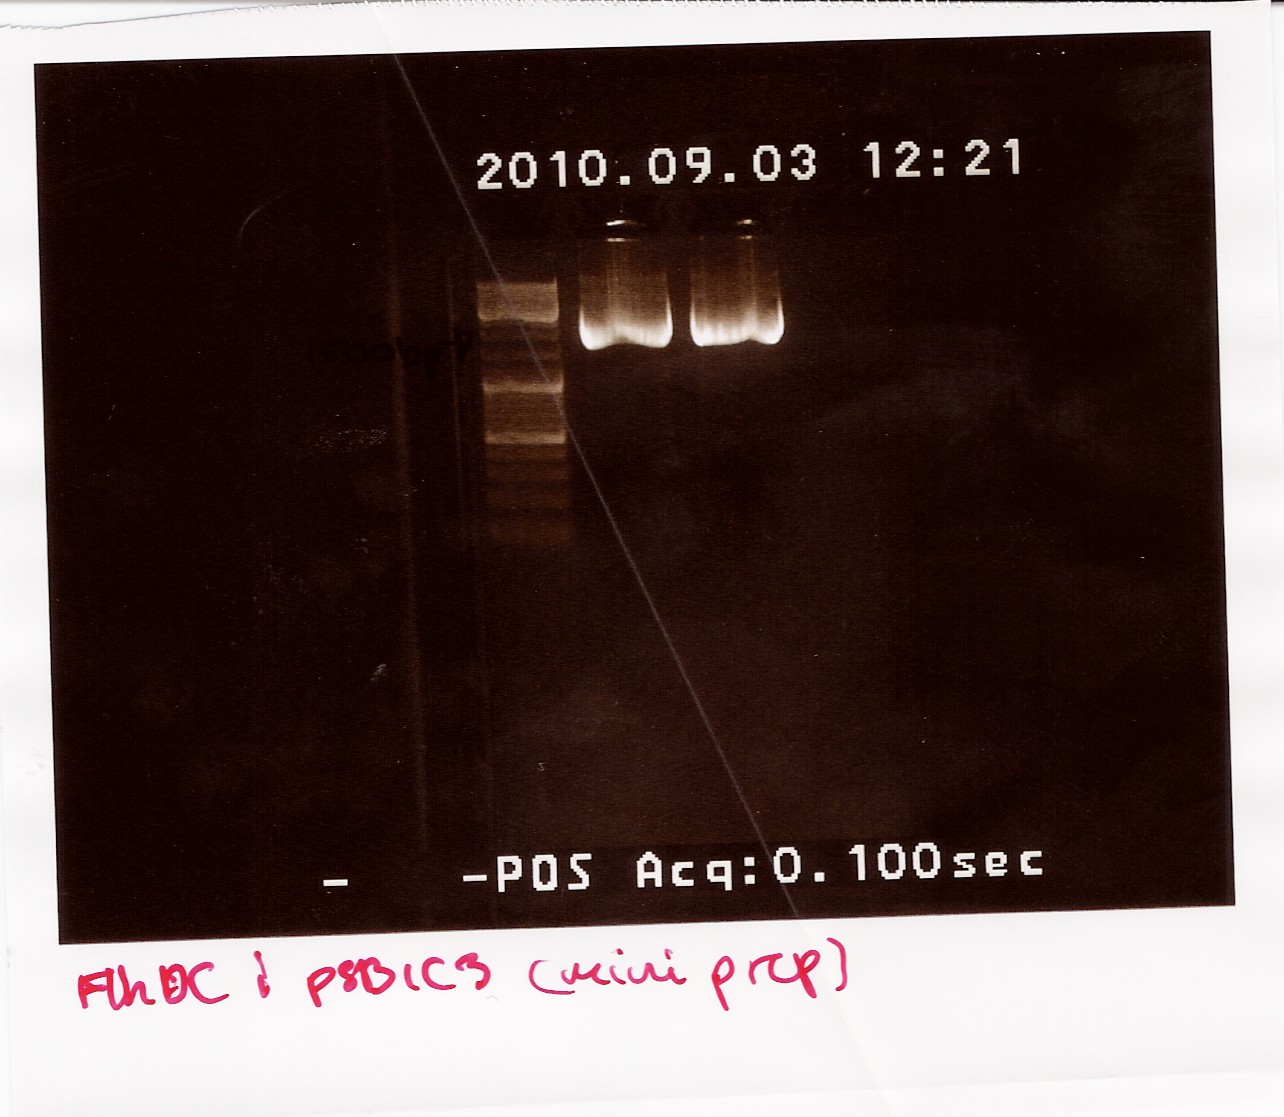
The samples were run on a 1.5% gel with a 10kb ladder. The bands are positioned between 1500bp and 1200bp. FlhDCmut in pSB1C3 is 1248bp.

Photosensor
PCR on pKJ606 with PSfw and VR primers
Date: 31/8
https://2010.igem.org/wiki/index.php?title=Team:SDU-Denmark/labnotes8&action=edit§ion=3
Done by: LC
Methods: PCR
Protocols: CP1.3[1]
Notes:
Premix:
7,5 µl 10xTAQ Buffer
3 µl MgCl2
3 µl VF2
3 µl VR
1,5 µl dNTP
55,5 µl H2O
3 µl template (PS1 miniprep)
3/8 µl TAQ Polymerase
PCR Program:
| Start |
94 C |
2 min |
| Denaturing |
94 C |
1 min |
| Annealing |
55 C |
1 min |
| Elongation |
72 C |
3 min |
| Goto2 |
rep |
29x |
| End |
72 C |
3 min |
| Hold |
4 C |
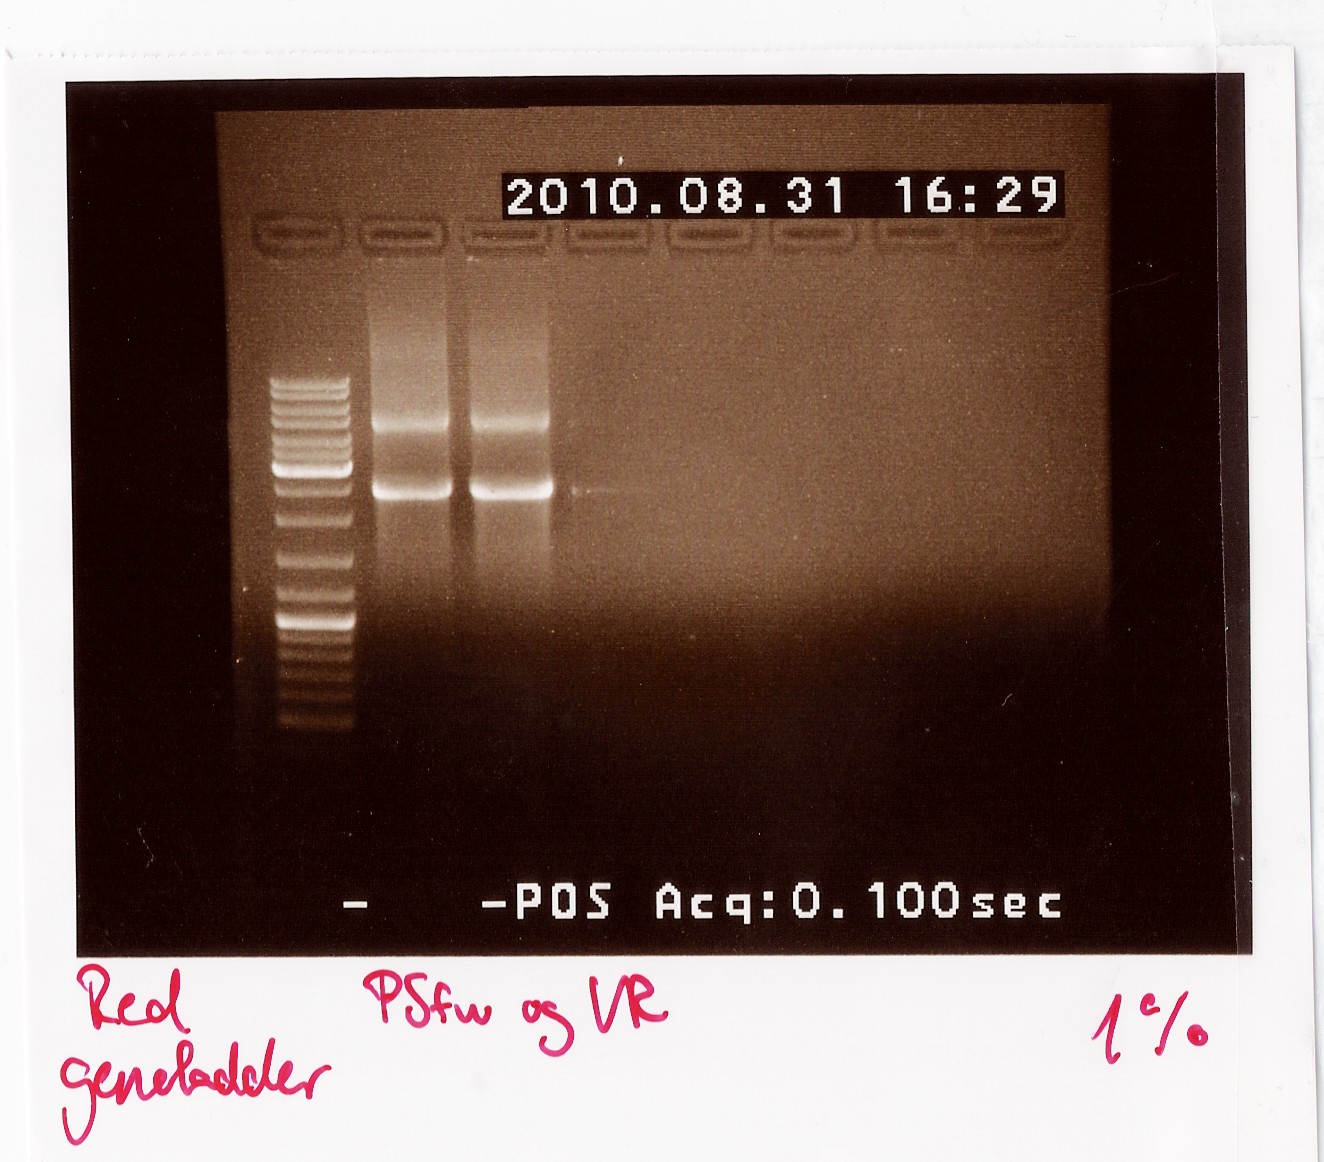
Results: The bands that showed up were around 2500 BP as expected from the sequencing results. This means that the designed primers have a high possibility of working, so that they will be ordered.

PCR on pKJ606 with PSfw and PSrv primers
Date: 02/09
Done by: LC
Methods: PCR
Protocols: CP1.3[2]
Notes:
Premix:
7,5 µl 10xTAQ Buffer
3 µl MgCl2
3 µl VF2
3 µl VR
1,5 µl dNTP
55,5 µl H2O
3 µl template (PS1 miniprep)
3/8 µl TAQ Polymerase
PCR Program:
| Start |
94 C |
2 min |
| Denaturing |
94 C |
1 min |
| Annealing |
55 C |
1 min |
| Elongation |
72 C |
2 min |
| Goto2 |
rep |
29x |
| End |
72 C |
3 min |
| Hold |
4 C |
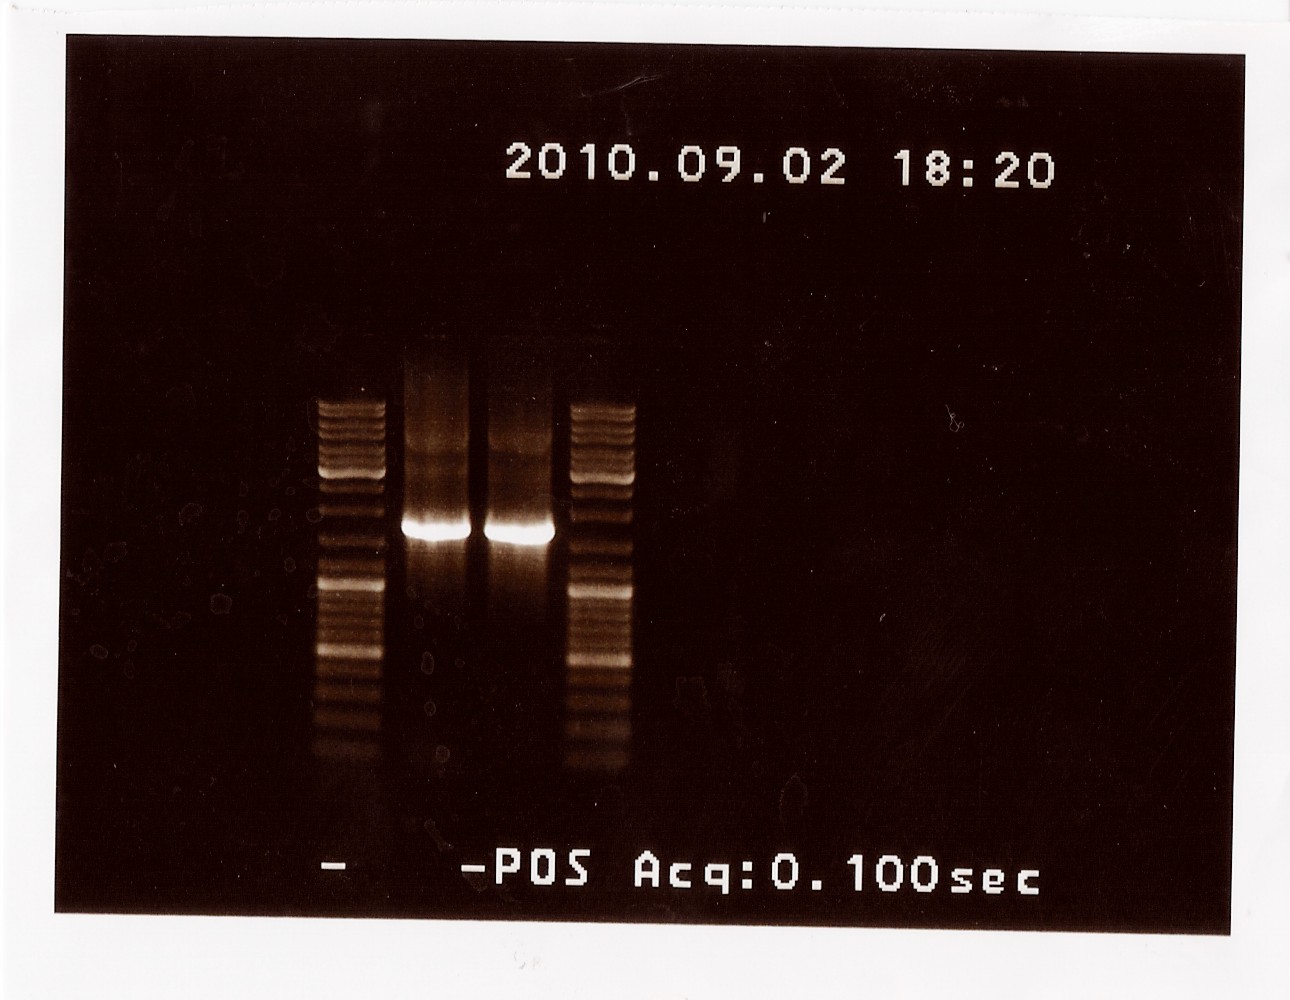
Results: The bands that showed up were around 1750 BP, further confirming sequencing results. New primers for taking the whole gene out have been ordered.

PCR on pKJ606 with fwPS2 and rvPS2 primers
Date: 04/09
Done by: LC
Methods: PCR
Protocols: CP1.3[3]
Notes:
Premix:
12,5 µl 10xTAQ Buffer
5 µl MgCl2
5 µl VF2
5 µl VR
2,5 µl dNTP
59,5 µl H2O
4 µl template (Consisting of 2 µl H2O and 2 µl of pKJ606 miniprep)
1/2 µl TAQ Polymerase
PCR Program:
| Start |
94 C |
2 min |
| Denaturing |
94 C |
1 min |
| Annealing |
55 C |
1 min |
| Elongation |
72 C |
2:30 min |
| Goto2 |
rep |
29x |
| End |
72 C |
3 min |
| Hold |
4 C |
Results: Primers were confirmed working, the next step will be PFU pcr.
Retinal
Coloni PCR on transformations of NinaB in PSB1C3, K343005 in PSB3C5 and K343005 in PSB1AK3 with the dobbelt terminator
Date: 30/09
Done by: Tommy
Methods: PCR
Protocols: CP1.3[4]
Notes:
Because the first coloni PCR of the transformants didn't give us the the right pieces 32 new colonies where chosen:
32-40: ninaB in PSB1C3
41-48: K343005 in PSB3C3
49-64: k343005 in PSB1AK3
VF2 and VR used as primers in the TAQ PCR:
PCR Program:
| Start |
94 C |
2 min |
| Denaturing |
94 C |
1 min |
| Annealing |
55 C |
1 min |
| Elongation |
72 C |
2:30 min |
| Goto2 |
rep |
29x |
| End |
72 C |
5 min |
| Hold |
4 C |
Colonies 34, 37, 61 and 63 was selected for minipreps and freezing cultures.
dobbelt transformation of K343005 in PSB1C3 and K274210 in PSB1A2 in to top10 and MG1655 E. Coli
Date: 1/10
Done by: Tommy & Marie
Methods: transformation
Protocols: TR1.1[5]
Notes:
Top10 and MG1655 E. coli competent cells where prepared according to protocol
Minipreps of K343005 and K274210 was used
1uL of K343005 and 3uL of K274210 was used becaus og their differens in concentration. The rest was done accordin to the transformations protocol.
Coloni PCR on dobbelt transformants of K343005 in PSB1C3 and K274210 in top10 and MG1655 E. coli
Date: 2/10
Done by: Tommy
Methods: Coloni PCR
Protocols: CP1.3[6]
Notes:
8 Colonies from each strain of E. Coli where chosen:
1-8: K343005 in PSB1C3 and K274210 in PSB1A2 in top10
9-16: K343005 in PSB1C3 and K274210 in PSB1A2 in MG1655
VF2 and VR used as primers in the TAQ PCR:
PCR Program:
| Start |
94 C |
2 min |
| Denaturing |
94 C |
1 min |
| Annealing |
55 C |
1 min |
| Elongation |
72 C |
5 min |
| Goto2 |
rep |
29x |
| End |
72 C |
5 min |
| Hold |
4 C |
Colonies 2, 7, 11 and 12 was selected for minipreps and freezing cultures.
Miniprep on ninaB in PSB1C3 and K343005 in PSB1AK3
Date: 2/10
Done by: Tommy
Methods: Miniprep
Protocols: MP1.2[7]
Notes:
Colonies 34 and 37 contain ninaB in PSB1C3
Colonies 61 and 63 contain K343005 in PSB1AK3
The miniprep was done according to protocol
The minipreps was dryed down and sendt to seqvensing
Further Characterization of BBa_K274210 in MG1655 and TOP10
Date: 3/10
Done by: Tommy
Methods: Miniprep
Protocols: MP1.2[8]
Notes:
Further characterization of the BioBrick K274210 has been performed in Top10 and MG1655 E. coli. The experimental data have shown somewhat similar results for Top10 and MG1655 E. coli.
The experiment was performed as follows:
Over night (ON) cultures were grown from 4 colonies, until the following OD’s were obtained:
Top 10 - no insert OD = 0,008 (100 x diluted)
Top 10 - with K274210 insert OD = 0,011 (100 x diluted)
MG1655 - no insert OD = 0,020 (100 x diluted)
Mg1655 - with K274210 insert OD = 0,017 (100 x diluted)
ON cultures were grown in 110 ml LB media. Colonies with K274210 insert were grown in LB media containing ampicillin. All ON cultures were grown for 20 hours at 37 °C. After 16 hours, 10 ml of the ON cultures were transferred into 110 ml LB media and grown for 4 hours to reach the exponential phase, where the following OD’s were obtained:
Top 10 - no insert OD = 0,049 (100 x diluted)
Top 10 - with K274210 insert OD = 0,044 (100 x diluted)
MG1655 - no insert OD = 0,007 (100 x diluted)
Mg1655 - with K274210 insert OD = 0,009 (100 x diluted)
Cultures with K274210 insert were grown in media containing ampicillin.
100 mL cell culture were centrifuged for 5 min at 14000 RPM. The supernatant was discarded and cells were resuspended in 5 mL acetone (99,9%), except the Top 10 E. coli with the K274210 insert, which was resuspended in 10 mL acetone (source of error). The resuspended cells were sonicated for 5 min. Samples were spun down, the supernatant was transferred to new tubes, and cell debris was discarded. A standard curve was made from pure beta-carotene.
The samples at the OD’s seen above as well as solutions of pure beta-carotene with known concentrations were measured at a fixed wavelength of 456 nm. Known concentrations and their absorbances:
| Concentration | Absorbance |
| 1 mM | 4,000 |
| 100 µM | 2,260 |
| 50 µM | 4,000 |
| 25 µM | 0,155 |
| 10 µM | 0,893 |
| 5 µM | 0,440 |
| 1 µM | 0,075 |
| 100 nM | 0,015 |
| 10 nM | 0,038 |
| 1 nM | 0,005 |
| 100 pM | 0,024 |
The samples and their absorbances:
| Top 10 cells (Absorbance) | MG1655 E. coli mutant (Absorbance) | |
| Stationary phase control | 0,034 | 0,024 |
| Stationary phase with K274210 biobrick insert | 0,319 | 1,549 |
| Expotential phase control | 0,020 | 0,024 |
| Expotential phase with K274210 biobrick insert | 0,034 | 0,033 |
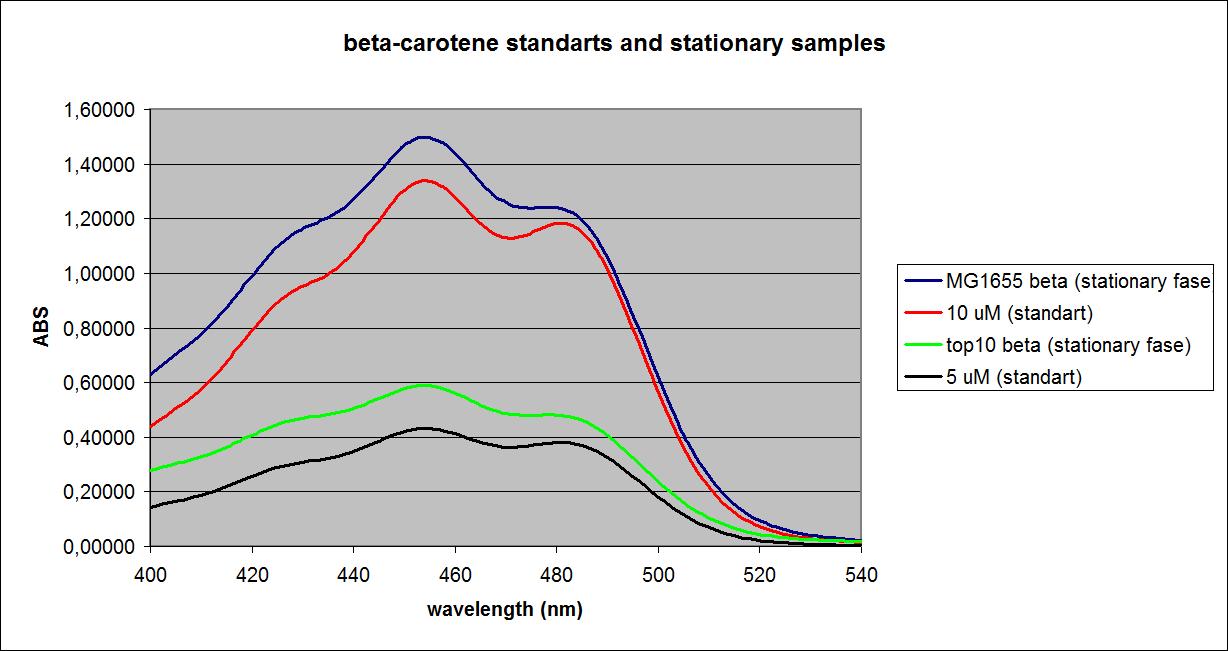
UV-VIS absorbance spectra of the known solutions were obtained, as well as spectra of the samples at the ODs shown above. The spectra of Top 10 and MG1655 in the stationary phase as well as selected spectra of known solutions are shown below:

These results were obtained from one experiment, which will be replicated later for more precision.
 "
"