Team:HokkaidoU Japan/Notebook/October2
From 2010.igem.org
Colony PCR
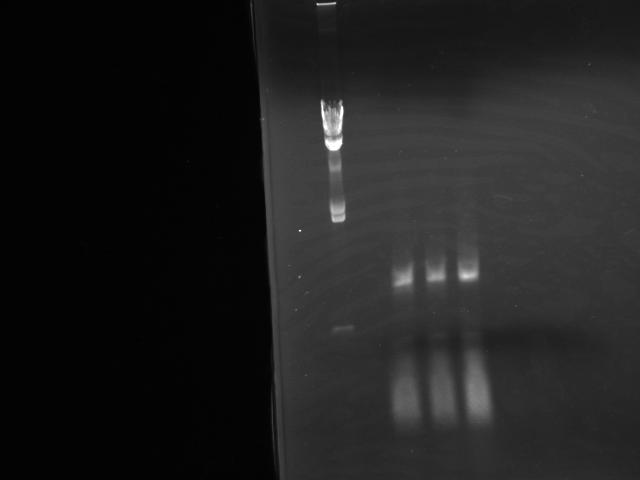
- Performed Colonie PCR for 3 colonies which were incubated over night (Fig.1)
- Colony numbers were: 1, 2 and 3
- Results showed no insertion
- but when result came, had already done miniprep and prepared Sequencing Master Mix
Miniprep
- Used Qiagen kit
- Melted in 50 uL TE instead of H2O
Preparation for Sequencing
- Mixed as shown in the table below
5x Sequencing Buffer 1.5uL 24.75 uL Ready Reaction Premix 1 uL 16.5 H2O 5 uL 80 uL total 7.5/sample
| Reagent | Amount | Amount for 16.5 |
|---|---|---|
| 5x Sequencing Buffer | 1.5uL | 24.75 uL |
| Ready Reaction Premix | 1 uL | 16.5 |
| H2O | 5 uL | 80 uL |
| Total | 7.5/sample | 121.25 |
3 Piece Ligation: Retry
Gel Extraction
Gel Extraction of DNAs that had been cut on October 1
- Couldn't see T3SS signal's bands, retried digestion like below
Digestion: Retry
| Reagent | Amount |
|---|---|
| 10x M buffer | 10 uL |
| DW | 64 |
| T3SS signal | 6 |
| BSA | 10 |
| Xba I | 9.6 |
| Pst I | 0.4 |
| Total | 100 uL |
-> Electrophoresed with other samples
2 piece ligation of T3SS signal and pSB1C3 for DNA Submission
T3SS signal
| Reagent | Amount |
|---|---|
| 10x M buffer | 2 uL |
| DW | 12 |
| DNA | 3 |
| BSA | 2 |
| EcoR I | 0.5 |
| Pst I | 0.5 |
| Total | 20 uL |
pSB1C3
| Reagent | Amount |
|---|---|
| 10x M buffer | 2 uL |
| DW | 13 |
| DNA | 2 |
| BSA | 2 |
| EcoR I | 0.5 |
| Pst I | 0.5 |
| Total | 20 uL |
->Incubated at 37C for 2 hrs
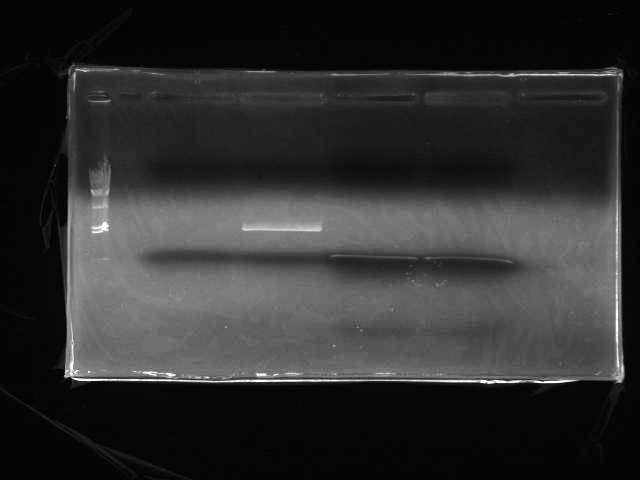
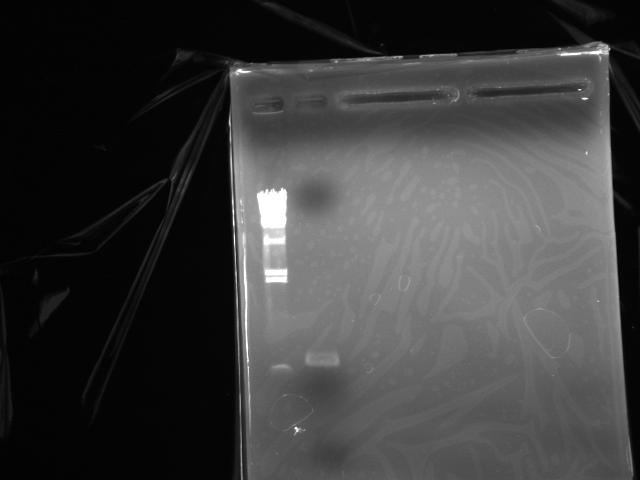
- Electrophoresis (Fig.2: λ/HindIII 2uL, T3SS signal, pSB1C3, T3SS signal for 3 piece ligation(applied to 2 wells))
Colony PCR (previous day's 3 piece ligation)
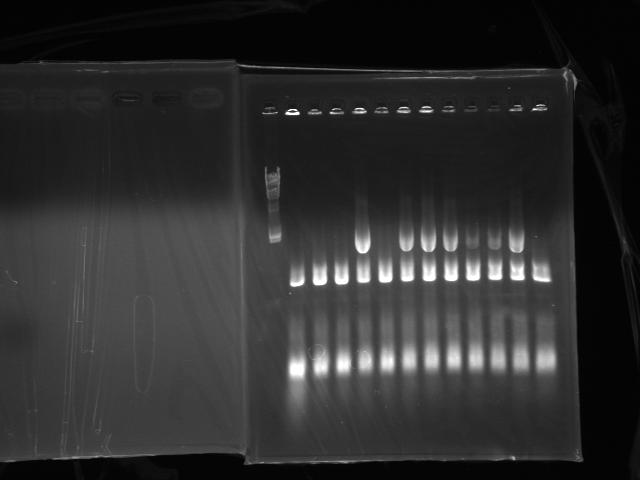
Did colony PCR of latecomers (No.5 to No.16)(Fig.3)
- No.8, 10, 11, 12, 15 looked like good
- Transfered No.8, 10, 11, 12, 13, 14, 15, 16(control) to 2 mL LBT (Tetracycline 15 ug/mL) and started incubation
Colony PCR (T3SS signal)
Did colony PCR to amplify T3SS signal (from BAC clone that has T3SS signal insertion)
- Colony solution 7 uL, quick Taq 10 uL, primer(Forward and Reverse) 1.5 uL each
- Extention: 90 sec, 40 cycles
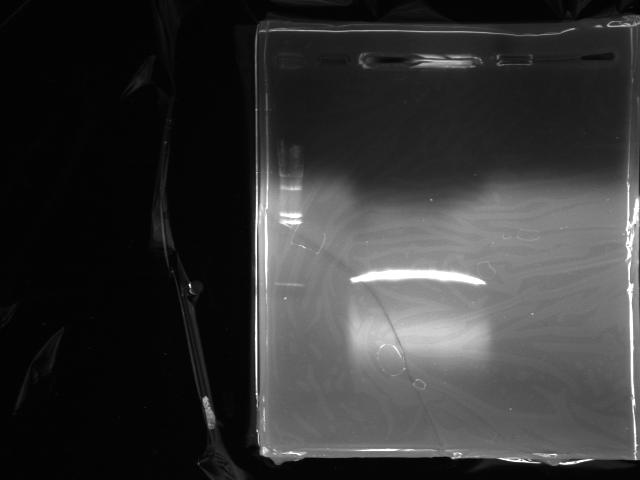
Electrophoresed to purify the DNA via gel extraction (Fig.4)
Electrophoresed to estimate the concentration of the DNA (Fig.5: λ/HindIII 2 uL, DNA solution 1 uL)
- Concentration was estimated at 40 ng/uL
Digestion
| Reagent | Amount |
|---|---|
| 10x H buffer | 2 uL |
| DW | 9 |
| DNA | 5 |
| BSA | 2 |
| EcoR I | 1 |
| Pst I | 1 |
| Total | 20 uL |
 "
"


