Team:Stockholm/28 August 2010
From 2010.igem.org
Contents |
Andreas
Gel extraction
| DNA concentrations | ||
|---|---|---|
| Sample | Conc [ng/μl] | A260/A280 |
| Extr. N-CPP | 40.91 | 1.69 |
| Extr. Dig SOD E+A | – | – |
| Pur. Dig pMA.His E+N | 36.02 | 1.80 |
From 27/8
Purified DNA from excised samples "Extr. Dig. SOD E+A" and "Extr. N-CPP cluster" using the E.Z.N.A. Gel extraction kit; procedures according to provided protocol.
Elution volume: 30 μl (eluted twice to increase DNA yield)
- Extr. N-CPP
- Extr. Dig SOD E+A
DNA purification of "Dig. pMA.His (E+N)"
From 27/8
DNA clean-up using the E.Z.N.A. Gel Extraction kit, following procedures for DNA purification.
Elution volume: 30 μl (eluted twice to increase DNA yield)
- Pur. Dig. pMA His E+N
Gel verification
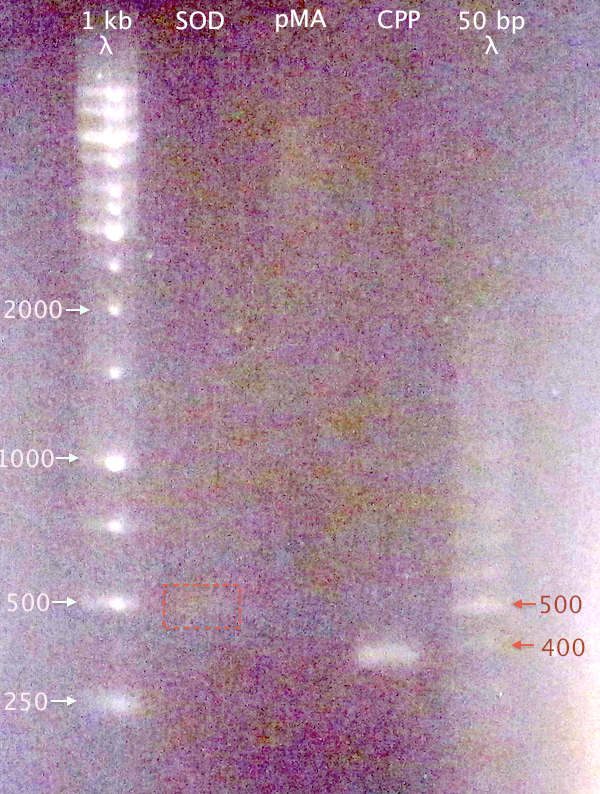
Since no DNA content was measurable for "Extr. Dig SOD E+A", a gel was run to verify DNA content in the three purified samples.
1 % agarose, 110 V
Samples:
- SOD: Extr. Dig SOD E+A
- pMA: Pur. Dig pMA.His E+N
- CPP: Extr. N-CPP cluster
Expected bands:
- SOD: 492 bp
- pMA: 2427 bp
- CPP: 379 bp
Results
- CPP resulted in a clear band of correct size.
- A very weak band at ≈500 bp is visible for SOD, which might be traces of DNA.
- No band visible for pMA.
Nevertheless, proceeded to ligation and cloning, hoping that the DNA is there.
Cloning of SOD into pMA.His
Ligation
| [μl] | |
|---|---|
| Extr. Dig SOD E+A | 12 |
| Pur. Dig pMA.His E+N | 3 |
| 5X Rapid Ligation buffer | 4 |
| T4 DNA ligase | 1 |
Incubation: 22 °C, 10 min
Transformation
- 3 μl ligation mix. 30 min on ice.
- 30 sec heat shock in 42 °C
- Cells grown on Amp 100 LB agar, 37 °C
Amplification of N-CPPs from N-CPP cluster
Ran PCRs from the gel extracted N-CPP cluster with the following primers:
- Tra10: pSB-VF2 & pSB-VR
- TAT: pEXf & pEXr
- LMWP: pGexf & pGexr
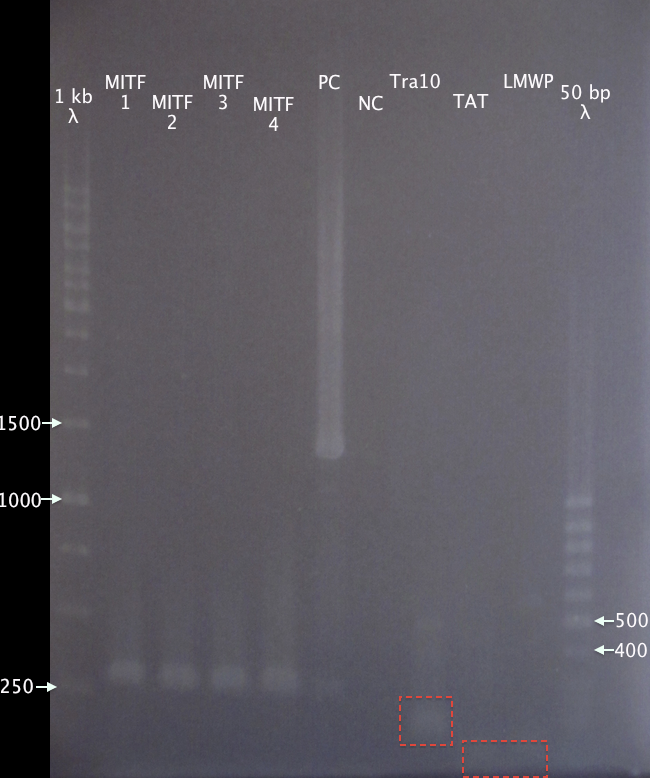
Also ran 4 colony PCRs for Mimmi from cells transformed with pSB1C3.MITF plasmids (MITF 1-4); positive control (PC) pSB1C3.RFP; negative control (NC) blank; primers pSB-VF2 & pSB-VR.
PCR tubes
- illustra Ready-to-Go PCR beads
- 22.5 μl dH2O
- 1 μl forward primer
- 1 μl reverse primer
- 0.5 μl template DNA
Standard colony PCR settings; 1:45 elongation time.
Gel verification
1 % agarose, 100 V
Expected bands:
- MITF: 1586 bp
- PC: 1385 bp
- Tra10: 182 bp
- TAT: 91 bp
- LMWP: 94 bp
Results
No relevant bands for MITF samples. Ran the gel too far for the CPP bands. Tra10 is still visible and seems correct. There might also be two bands at the very edge of the gel, supporting the 91 bp and 94 bp for TAT and LMWP, respectively.
Decided to go on with gel extraction of CPPs anyway.
Gel extraction
1 % agarose, 110 V. 22 μl sample (Tra10/TAT/LMWP)
Bands on UV table seemed correct relative to each other. Bands excised and gel excisions saved in -20 °C for later.
N-CPP
Plasmid prep
Prepared plasmid from Mimmi's 5 ml ON culture. 50 μl elution volume.
| [ng/μl] | A260/A280 | |
|---|---|---|
| N-CPP plasmid | 671.9 | 1.94 |
Glycerol stock
Inoculated 3 ml LB + Amp 100 with 10 μl from Mimmi's ON culture. Incubated 6 h 37 °C, 225 rpm.
Prepared glycerol stock:
- N-CPP 28/8
 |

|
 |

|
 |

|

|

|
 "
"


