Team:TU Delft/21 July 2010 content
From 2010.igem.org
Contents |
Lab work
Ordered DNA
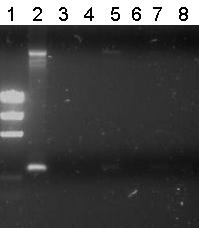
The transformations of 19 July containing the different ligations gave colonies (~5 per plate). We picked 5 colonies per plate and performed a colony PCR.
Alkane degradation
Unfortunately there were no transformants on yesterday's plates. This is most likely due to the fact that the ligation didn't work with the small pieces of DNA of the RBSs. Next plan is to cut open the RBS plasmid without removing the RBS (with SpeI and PstI) and insert the gene in this plasmid. We will try this tomorrow.
Salt Tolerance
The overnight ligation was transformed using the standard method and grown up overnight at 37 degrees C.
Emulsifier
Lane Description
| # | Description | Expected lenght (bp) | Primer | Status |
| M1 | EZ Ladder | n/a | n/a | n/a |
| 1 | B0032 (control) | 220 | G00100 + G00101 | ✓ |
| 2 | Transformant #1 of ligation mix R0011-B0032 | 300 | G00100 + G00101 | ✗ |
| 3 | Transformant #2 of ligation mix R0011-B0032 | 300 | G00100 + G00101 | ✗ |
| 4 | Transformant #3 of ligation mix R0011-B0032 | 300 | G00100 + G00101 | ✗ |
| 5 | Transformant #4 of ligation mix R0011-B0032 | 300 | G00100 + G00101 | ✗ |
| 6 | Transformant #5 of ligation mix R0011-B0032 | 300 | G00100 + G00101 | ✗ |
| 7 | Transformant #6 of ligation mix R0011-B0032 | 300 | G00100 + G00101 | ✗ |
| 8 | Transformant #7 of ligation mix R0011-B0032 | 300 | G00100 + G00101 | ✗ |
Unfortunately all other lanes were empty or the same as the negative control. So from this gel we conclude that the ligation has failed.
Characterisation of Anderson RBS sequences
Assembly of reference construct
Method 1
Hypothesis II The transformants that were replated on kanamycin plates produced colonies, indicating that hypothesis II was invalid.
Method 4
The obtained colonies on ampicillin plates were screened for GFP fluorescence, those that fluoresced were inoculated in 5 mL of LB medium for over night growth.
Solvent Tolerance and Hydrocarbon Sensing
Characteristic digestion of isolated plasmids
To determine whether the plasmids are correct. Characteristic cuts were made using the restriction enzyme PvuI.
| # | Sample | Enzyme 1 | Buffer | Needed fragments |
| 1 | 1450 μg K398328T | PvuII | Buffer II | 252, 1647, 69, 36, 3246 |
| 2 | 378 μg K398407T | PvuII | Buffer II | 2552 |
| 3 | 716.5 μg Control (pSB1T3, B0015: this does not ligate) | PvuII (this enzyme does not work here) | Buffer II | 172, 2463 |
| 4 | 245.4 μg K398300C | PvuII | Buffer II | 654, 252, 1647, 69, 36, 2004 |
| 5 | 1481.4 μg K398000C | PvuII | Buffer II | 495, 2901 |
| 6 | 1198.5 μg K398002C | PvuII | Buffer II | 2243 |
| 7 | 42.3 μg K398002C | PvuII | Buffer II | 3120 |
| 8 | 1612.8 μg K398200C | PvuII | Buffer II | 558, 135, 177, 1887 |
| 9 | 1633.3 μg K398201C | PvuII | Buffer II | 2529 |
| 10 | 938.6 μg K398400C | PvuII | Buffer II |
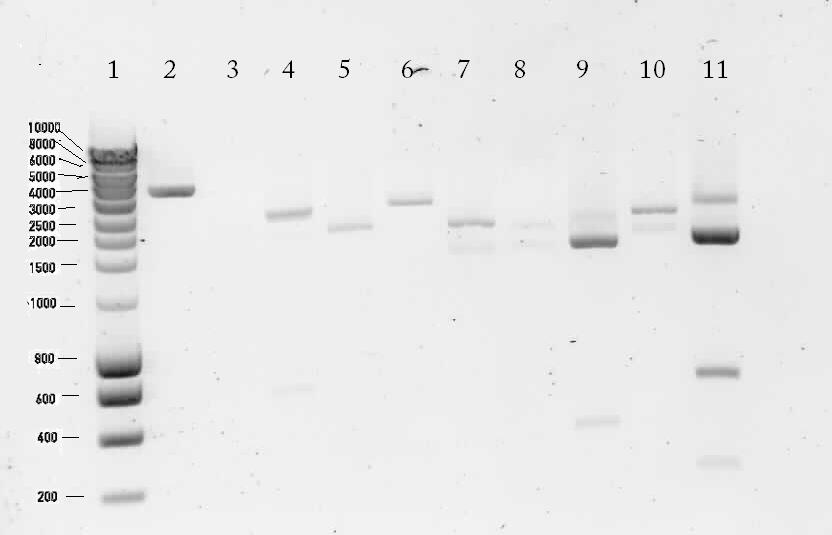
Results of the digestion on 1% agarose gel
Lane description:
| # | Description | Expected Length (bp) | Status | Remarks |
| 1 | marker | n/a | n/a | n/a |
| 2 | Digested K398328T | 252, 1647, 69, 36, 3246 | ✗ | |
| 3 | Digested K398407T | 2552 | ✗ | |
| 4 | pSB1T3 with B0015 (control) | 172, 2463 | ✗ | The upper band is most likely circular pSB1T3. There's a strange band around 600 bp. |
| 5 | Digested K398000C | 654, 252, 1647, 69, 36, 2004 | ✗ | |
| 6 | Digested K398000C | 495, 2901 | ? | There's no band of 495 bp |
| 7 | Digested K398002C | 2243 | ✓ | |
| 8 | Digested K398200C | 3120 | ✗ | |
| 9 | Digested K398201C | 558, 135, 177, 1887 | ✓ | |
| 10 | Digested K398400C | 2529 | ✗ | |
| 11 | pSB1T3 (control) | 2463 | ? | A bright band around 2500 bp was shown. There are also a lot of unexplainable bands visible. |
 "
"

