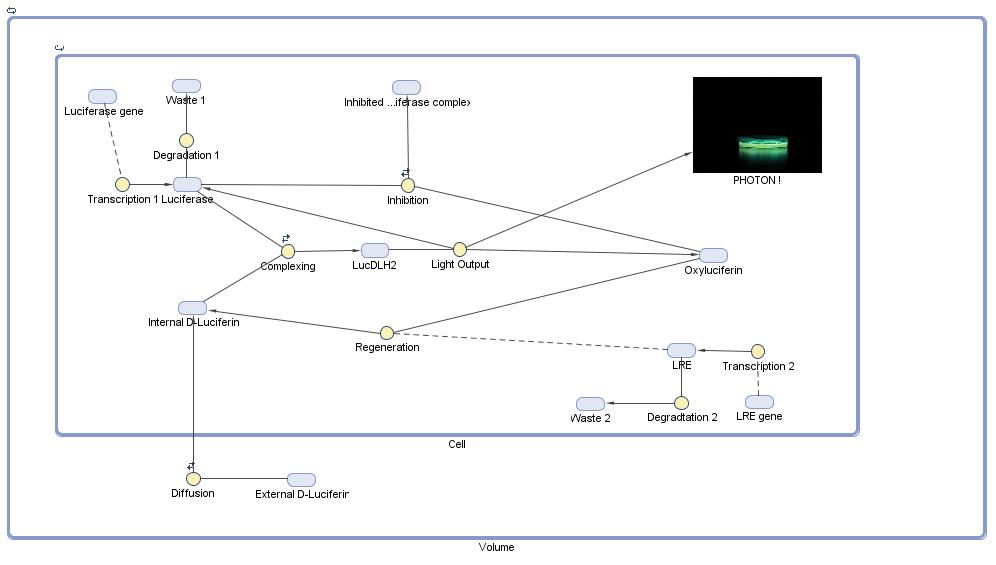
We modelled the Luciferin cycle as described by [http://www.ncbi.nlm.nih.gov/pubmed/18949818 Marques 2009] and others. We were assisted by data from [http://www.ncbi.nlm.nih.gov/pubmed/19859663 S. Inouye (2010)] on the catlysis of light emission by luciferase and information [http://www.ncbi.nlm.nih.gov/pubmed/20655239 J.M Leitão
et al. (2010)] on the inhibition of the enzyme.
We used the [http://www.mathworks.com/products/simbiology/ Matlab Simbiology toolbox] to model the cycle. A diagram of the model we developed can be found below:
Some parameters were taken from literature. However there was no clear data for others, such that we were only able to define some parameters in the light of experimental data.
While attempting to optimise our system we modelled the effect of Luciferin Regenerating Enzyme (LRE)
We modelled the system both with and without the effect of the Luciferase Regenerating Enzyme (LRE.) The 4 Figures below show a comparison the model and our data for both cases.

Figure 1 - Model of the light output as a function of time without the effect of the LRE. Our model suggested that the LRE would make light output increase faster, peak higher and decay more slowly. These were all qualities which suited us.
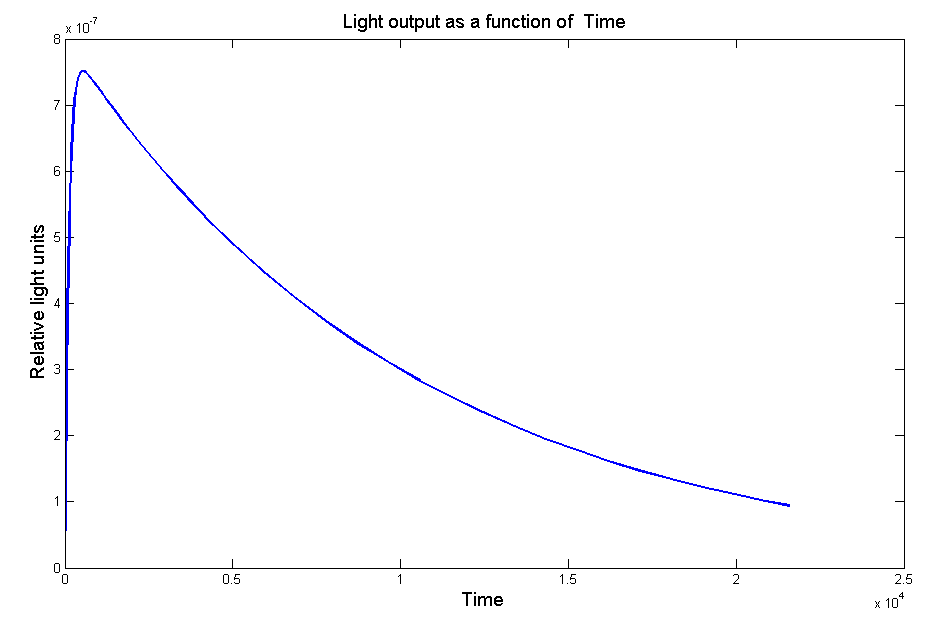
Figure 1 - Model of the light output as a function of time without the effect of the LRE.
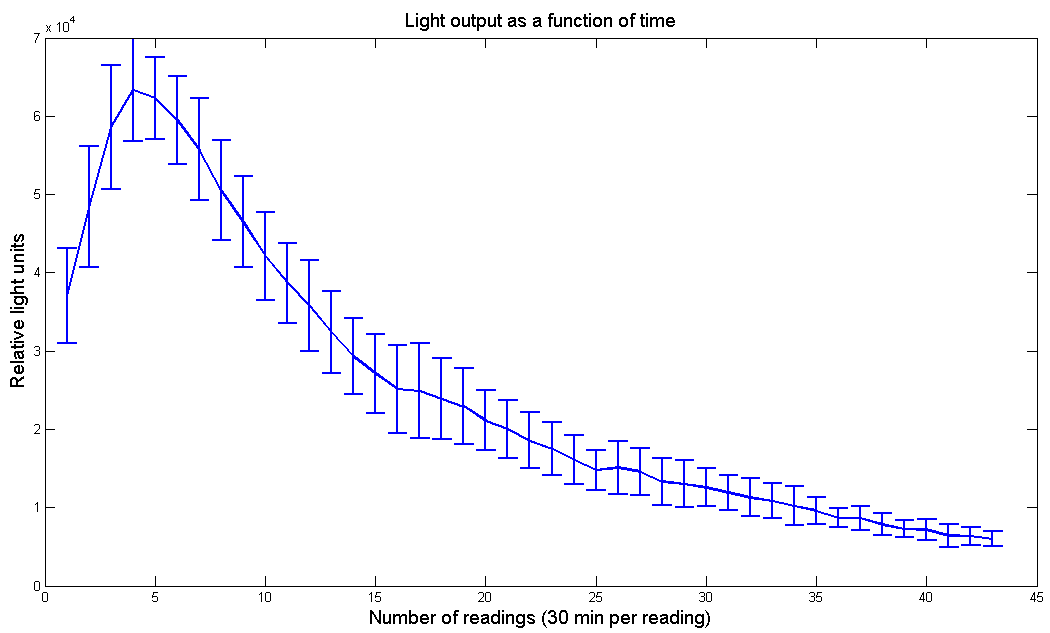
Figure 2 - Light output as a function of time for [http://partsregistry.org/Part:BBa_K325108 P.Pyralis luciferase] under pBad promoter. Arabinose concentration is 10mM and D-Luciferin concentration is 100µM
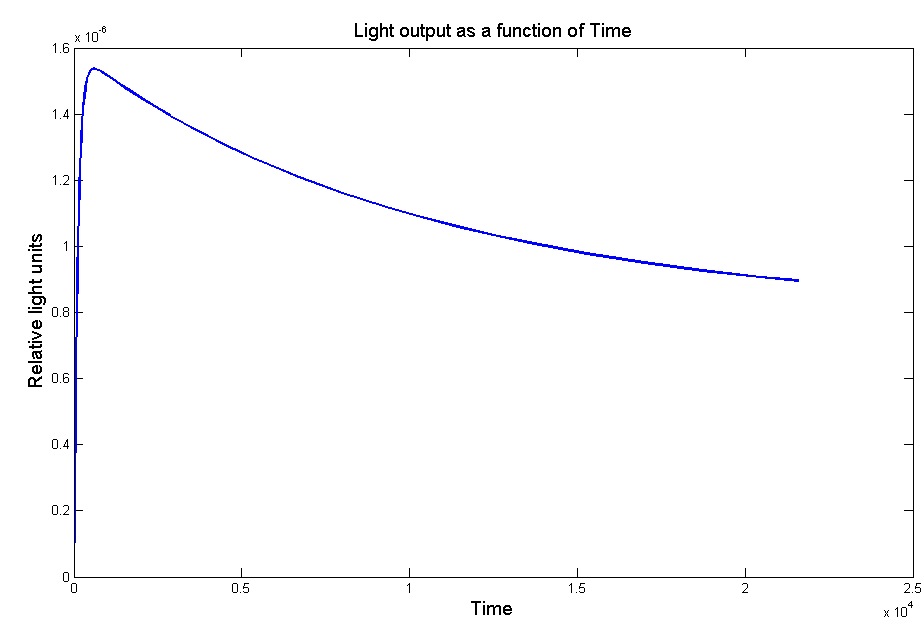
Figure 3 - Model of the light output as a function of time with the effect of the LRE.
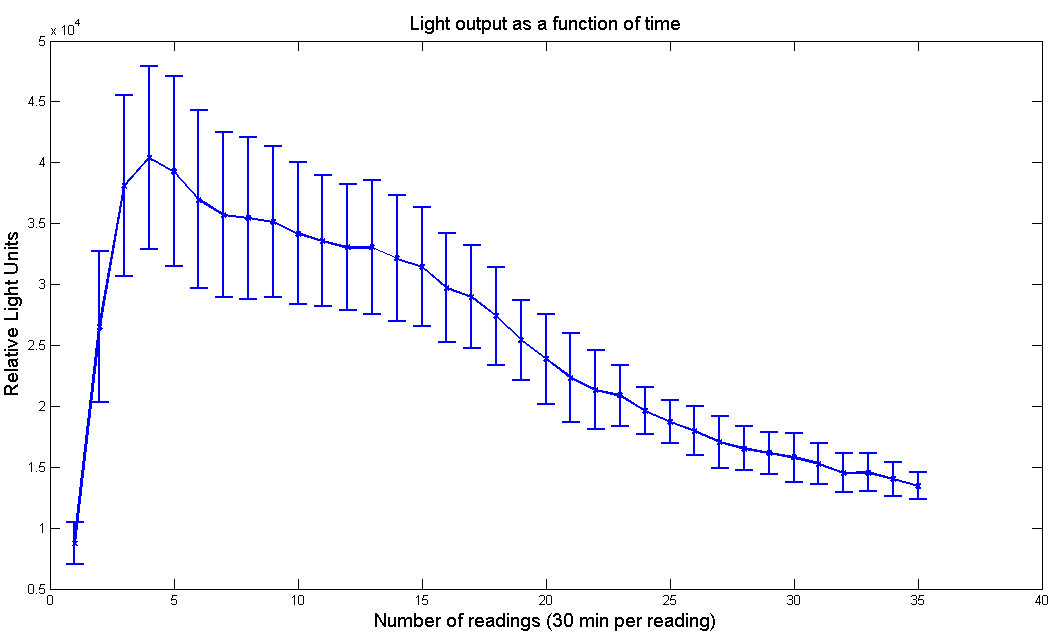
Figure 4 - Light output as a function of time for [http://partsregistry.org/Part:BBa_K325219 L. Cruciata luciferase with LRE] under pBad promoter. Arabinose concentration is 100 µM and D-Luciferin concentration is 1µM

 "
"
