Team:Stockholm/7 September 2010
From 2010.igem.org
Contents |
Andreas
Cloning of N-CPPs into pSB1C3
Transformation results
From 6/9 transformations
Good colony yields on both plates, 1 and 2*.
Colony PCR
4 colonies picked from each plate for verification by colony PCR.
- 1, 2, 3, 4, 5*, 6*, 7*, 8*
- PC: pSB1C3.RFP
| PCR tubes | |
|---|---|
| dH2O | 16.22 |
| DreamTaq buffer | 2 |
| dNTP, 10 mM | 0.4 |
| Fwd primer (VF2) | 0.4 |
| Rev primer (VR) | 0.4 |
| Cell suspension | 0.5 |
| DreamTaq pol. | 0.08 |
| 20 μl | |
Standard colony PCR settings
- Elongation time: 0:45
Gel verification
1.5 % agarose, 90 V.
Expected bands
- pSB1C3.Tra10: 389 bp
- pSB1C3.TAT: 359 bp
- pSB1C3.LMWP: 368 bp
Results
Relevant bands in clones 3, 4, 6, 7 & 8. Slightly different in size, which could indicate presence of all three N-CPPs. All clones selected for sequencing.
ON cultures
For plasmid prep
- pSB1C3.N-CPP: pC.NCPP 3, 4, 6*, 7* and 8*
- 5 ml LB + Cm 25
- 37 °C, 200 rpm ON
PCR product digestion
From 6/9 PCR
| 10X Buffer Tango | 5 |
| PCR DNA | 40 |
| dH2O | 0 |
| AgeI | 2 |
| XbaI | 1 |
| 50 μl |
|---|
- Incubation: 37 °C, 3 h
- Inactivation: 80 °C, 20 min
Gel verification
1.5 % agarose, 90 V
Expected bands
- Tra10: 182 bp
- TAT: 91 bp
- LMWP: 94 bp
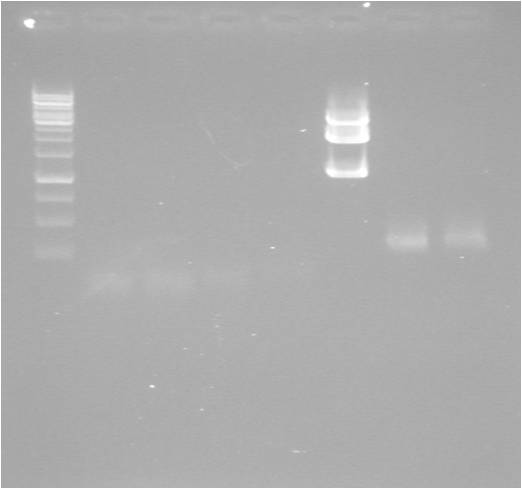
Results
Very irregular band sizes in the "lower" region, making no sense. Sizes not at all corresponding to what was expected.
Higher up very regular bands. This is even more puzzling, since different primer pairs were used for each PCR reaction. Although concentration of plasmid should be too low, the bands seen may be undigested and digested N-CPP plasmid. A too large plasmid concentration may in turn be the cause of the unspecific bands seen lower down in the gel.
Transfer of m-yCCS into pEX
ON cultures
Set ON cultures of pEX.yCCS for plasmid prep and glycerol stocks. From 3/9 colonies.
- pEX.yCCS 5 and 8
- 5 ml LB + Amp 100
- 37 °C, 200 rpm ON
- pEX.yCCS 5 and 8
- 5 ml LB + Amp 100
- 30 °C
Mimmi
SOD.his / his.SOD
col-PCR
| mix | (µl) | x9 x2 | primers | conditions | ||||
|---|---|---|---|---|---|---|---|---|
| sH2O | 13.5 | 121.5 | pSB_VF2 | time | °C | |||
| dNTP | 2 | 18 | pSB_VR | 2m | 95 | |||
| F primer | 0.8 | 7.2 | & | 30s | 95 | ) | ||
| R primer | 0.8 | 7.2 | pEX_VF | 30s | 55 | > 30 cycles | ||
| buffer | 2 | 18 | pEX_VR | 1m45s | 72 | ) | ||
| polymerase | 0.4 | 3.6 | 10m | 72 | ||||
| DNA | 0.5 | OO | 10 | |||||
| tot | 20µl | 180µlx2 | ||||||
gel
| well | sample | well | sample |
|---|---|---|---|
| 1 | ladder | 12 | ladder |
| 2 | pSB1C3.SOD.his 1 | 13 | pEX.SOD.his 1 |
| 3 | pSB1C3.SOD.his 2 | 14 | pEX.SOD.his 2 |
| 4 | pSB1C3.SOD.his 3 | 15 | pEX.SOD.his 3 |
| 5 | pSB1C3.SOD.his 4 | 16 | pEX.SOD.his 4 |
| 6 | pSB1C3.his.SOD 1 | 17 | pEX.his.SOD 1 |
| 7 | pSB1C3.his.SOD 2 | 18 | pEX.his.SOD 2 |
| 8 | pSB1C3.his.SOD 3 | 19 | pEX.his.SOD 3 |
| 9 | pSB1C3.his.SOD 4 | 20 | pEX.his.SOD 4 |
| 10 | positive control | 21 | blank |
- Nothing...
MITF-M
Digestion
| Mix | (µl) | (µl) | Conditions | |||
|---|---|---|---|---|---|---|
| DNA | 40 | 10 | Time | °C | ||
| 10x buffer | 5 | 5 | 30m | 37 | ||
| sH2O | 3 | 4 | 20m | 65 | ||
| EcoRI | 1 | PstI | 1 | oo | 10 | |
| SpeI | 1 | 0 | ||||
| tot | 50µl | 20µl | ||||
Gel
| well | sample |
|---|---|
| 1 | ladder |
| 2 | MITF-M |
| 3 | MITF-M |
| 4 | MITF cut E+S |
| 5 | MITF cut P |
| 6 | pSB1C3 cut E+S |
| 7 | pSB1C3.MITF lig |
| 8 | pSB1C3.MITF lig |
Ligation (nr3)
| mix | (µl) | [pSB1C3]~100ng/µl | conditions | |||
|---|---|---|---|---|---|---|
| pSB1C3 | 2 | time | °C | |||
| MITF-M | 13 | 10m | 22 | |||
| 5xbuffer | 4 | |||||
| T4 ligase | 1 | |||||
| sH2O | 0 | |||||
| tot | 20µl | |||||
Transformation
- Follow original protocol
 "
"


