Team:BCCS-Bristol/Wetlab/0-10mM Assay
From 2010.igem.org
(Difference between revisions)
(New page: ==Characterising the Biobrick - 0 - 10mM assay== Having established the biobrick was definitely switched on by 20mM of KNO3, we wanted to conduct a broader test of its behaviour across a ...) |
(→Characterising the Biobrick - 0 - 10mM assay) |
||
| Line 3: | Line 3: | ||
Having established the biobrick was definitely switched on by 20mM of KNO3, we wanted to conduct a broader test of its behaviour across a range of different nitrate levels | Having established the biobrick was definitely switched on by 20mM of KNO3, we wanted to conduct a broader test of its behaviour across a range of different nitrate levels | ||
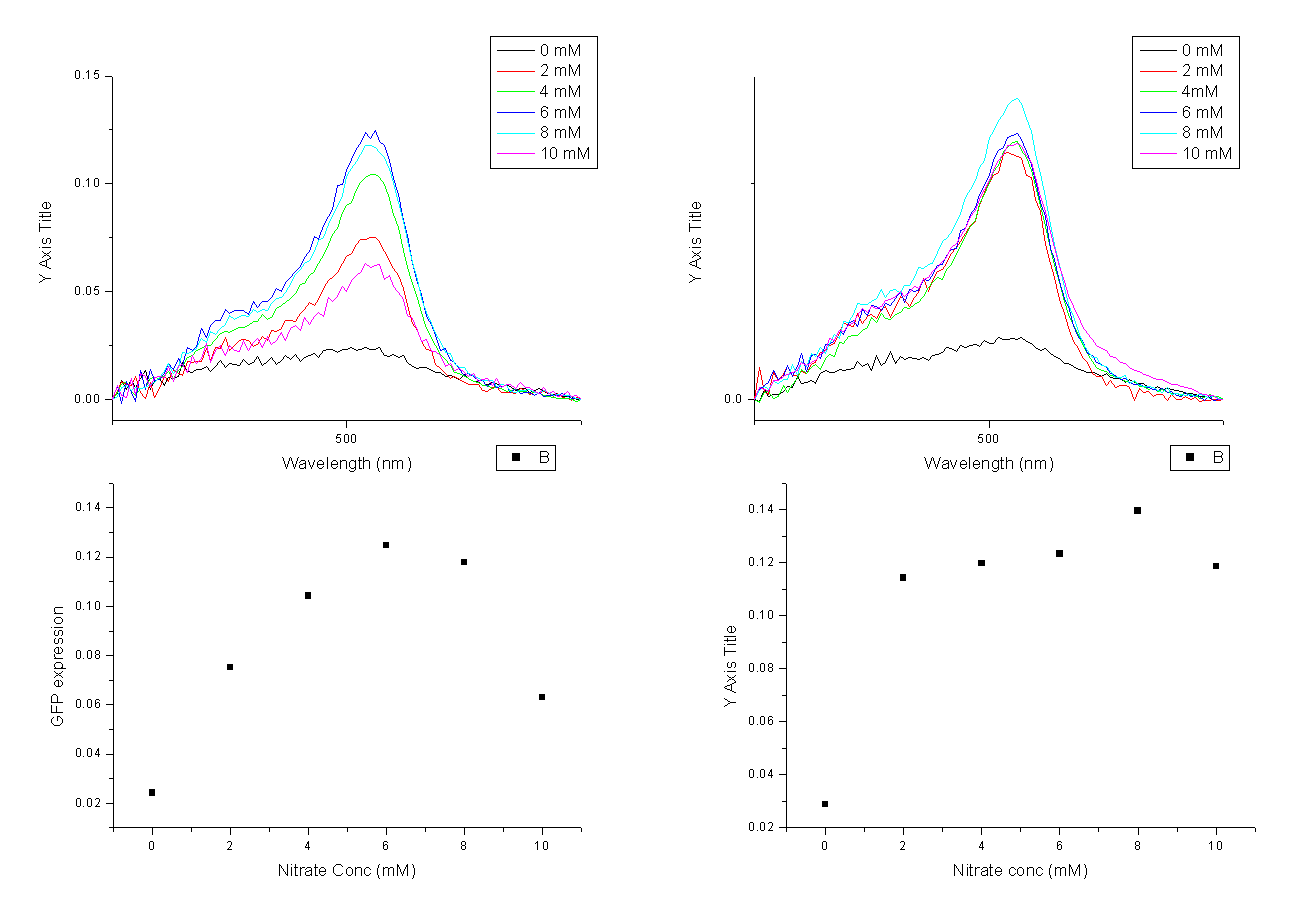
| - | An assay was set up between 0 – 10 mM of Potassium Nitrate at 2mM intervals. The same colony of MG1655 containing BBa_K381001 was used to inoculate six 5mL tubes of LB at varying nitrate levels as listed below. This was repeated twice to allow the results to be averaged | + | An assay was set up between 0 – 10 mM of Potassium Nitrate at 2mM intervals. The same colony of MG1655 containing BBa_K381001 was used to inoculate six 5mL tubes of LB at varying nitrate levels as listed below. This was repeated twice to allow the results to be averaged. |
| + | |||
| + | |||
| + | [[Image:0_to_10_assay.png||750px]] | ||
| + | |||
| + | Average: | ||
| + | |||
| + | [[Image:0 to 10 gfp average.png||600px]] | ||
| + | |||
| + | Unfortunately, because we only ran two repeats, we cannot be certain whether the downward curve of the graph is true behaviour or the result of one the 10mM readings being extremely low | ||
Revision as of 09:46, 13 October 2010
Characterising the Biobrick - 0 - 10mM assay
Having established the biobrick was definitely switched on by 20mM of KNO3, we wanted to conduct a broader test of its behaviour across a range of different nitrate levels
An assay was set up between 0 – 10 mM of Potassium Nitrate at 2mM intervals. The same colony of MG1655 containing BBa_K381001 was used to inoculate six 5mL tubes of LB at varying nitrate levels as listed below. This was repeated twice to allow the results to be averaged.
Average:
Unfortunately, because we only ran two repeats, we cannot be certain whether the downward curve of the graph is true behaviour or the result of one the 10mM readings being extremely low
 "
"

