Team:Michigan/Oil Sands
From 2010.igem.org
(→8/8/2010) |
(→8/8/2010) |
||
| Line 671: | Line 671: | ||
The OD 600 of the plate after the bioassay growth is shown in the following graph | The OD 600 of the plate after the bioassay growth is shown in the following graph | ||
| + | |||
| + | [[Image:8-6-2010_PCR_of_flu_operon.jpg|500px]] | ||
The Crystal Violet OD 600 after staining is show in the following graph | The Crystal Violet OD 600 after staining is show in the following graph | ||
| + | |||
| + | [[Image:8-6-2010_PCR_of_flu_operon.jpg|500px]] | ||
The Crystal Violet OD 600 to OD 600 after growth ratio is shown in the following graph | The Crystal Violet OD 600 to OD 600 after growth ratio is shown in the following graph | ||
| + | |||
| + | [[Image:8-6-2010_PCR_of_flu_operon.jpg|500px]] | ||
Revision as of 13:52, 9 August 2010
| Sunday | Monday | Tuesday | Wednesday | Thursday | Friday | Saturday | |
| Week 1 | - | 6/28/2010 | 6/29/2010 | 6/30/2010 | 7/1/2010 | 7/2/2010 | - |
| Week 2 | - | - | - | 7/7/2010 | 7/8/2010 | 7/9/2010 | 7/10/2010 |
| Week 3 | - | 7/12/2010 | 7/13/2010 | 7/14/2010 | - | - | - |
| Week 4 | - | - | - | - | - | - | - |
| Week 5 | 7/25/2010 | 7/26/2010 | 7/27/2010 | 7/28/2010 | 7/29/2010 | 7/30/2010 | 7/31/2010 |
| Week 6 | 8/1/2010 | 8/2/2010 | 8/3/2010 | 8/4/2010 | 8/5/2010 | 8/6/2010 | - |
| Week 6 | 8/8/2010 | - | - | - | - | - | - |
Oil Sands Lab Notebook
This team includes Ann Lesnefsky, Bryce Rajabian, and Kilho Lee.
6/28/2010
Pseudomonas putida KT2440 Antibiotic Resistance
- Protocol for starting overnight culture from -80°C freezer
- All protocols can also be found in the Protocols section of the Notebook
6/29/2010
Pseudomonas putida KT2440 Antibiotic Resistance
6/29/2010 and 6/30/2010
Pseudomonas putida KT2440 Antibiotic Resistance
7/1/2010
Literature Review Napthenic Acids Composition & HPLC Analysis
7/2/2010
Pseudomonas putida KT2440 Antibiotic Resistance
7/7/2010
Ann
Biobrick Transformation with Alex and Jennifer
- Made CaCl2 solution, and 100 mg/mL amphicilin stock solution according to the media section of the wiki
- Started an overnight culture of DH5alpha according to the heat shock transformation protocol
- A 12 mL culture was started because we were multiplying the protocol by 4
7/8/2010
Ann
Biobrick Transformation with Marc, Katie and Audra according to the heat shock transformation protocol
- Started culture for biobrick transformation from over night at 2:30
- At 5:00pm the cultures had overgrown to an OD600 of 1.2
- A a 1:3 dilution of cells was performed and the cells were allowed to go through another doubling period of 20 minutes
- The OD600 was measured again and found to be around 0.500
- the cultures were placed on ice at 5:30 and allowed to chill for 20 minutes
- The washings were performed and the comp cells were resuspended in the residual CaCl2 only
- The OD600 of the comp cells without the glycerol was above 0.3 therefore the comp cells were concentrated enough
- The heat shock was performed for the following biobricks
- BBa_179015
- BBa_179005
- BBa_145001
- BBa_117008
- BBa_117002
- BBa_103006
- The cultures were placed in the 30C shaker to grow up for an hour at 30C at 9:00pm
- The cultures were plated at 10:00pm
7/9/2010
Ann
Biobrick Transformation with Josh, Prae, Charlie according to the miniprep protocol
- After 9 hours of growing at 37C, the plates did not have any colonies on them
- After 22 hours of growth plates that had grown had clear colonies
- The positive and negative controls grew out accordingly
- Only BBa_179015 and BBa_179005 had colonies (both from plate 1 and none from plate 2...)
- BBa_179015 had over 100 colonies
- BBa_179005 had 2 colonies
- 5 mL overnight cultures were started with 100 mg/mL amp at 8pm from a single colony on each plate
7/10/2010
Ann
Biobrick Transformation with Marcus, Bryce, Kilho, Josh, Charlie, Jeremy
Miniprep
- Made frozen stocks from overnight culture of miniprep
- Performed miniprep on BBa_179015 and BBa_179005
- Measured DNA concentration with the Nanodrop
- BBa_179015-11 ng/mL
- BBa_179005-40 ng/mL
Digest
- Ran according to the digest protocol in the protocol section
- Cut parts with EcoRI and PstI
- Digested at 37C for 30 minutes
Gel
- Ran according to the protocol in the protocol section
- Used 8 well comb instead of 13 well comb so the samples were too dilute too see
7/12/2010
Ann
Biobrick Transformation with Jeremy
Gel
- Reran gel from 7/10/2010
- Lane 1-Invitrogen 1 kb plus ladder
- Lane 2-Digested Bba_179005
- Ran out of undigested Bba_179005
- Lane 3-Digested Bba_179015
- Lane 4-Uncut miniprep plasmid Bba_179015
We found that we successfully extracted BBa_179015, T7-GFP, because there were expected bands at 906 and 2079 as faintly seen in the gel picture above. No appeared for biobrick Bba_179005, T7 promoter, so this biobrick will be transformed again.
Biobrick Transformation take 2 with Jeremy
Autoclaved DI water for transformation and autoclaved sterile containers
- to autoclave sterile containers fill with DI water and decant the water before you start the culture in the container
7/13/2010
Biobrick Transformation take 2 with Jeremy, Marcus, Josh, Kevin, Audra, Katie
Ann
Performed according to the electroporation transformation
- Started the culture at 9:05am
- Removed the culture at 12:05pm with an OD600 of 0.809
- The OD600 of the comp cells were 1.2 after washing
- The time constant for all electroporation were between 5.6 and 5.8 for the following biobricks
- Bba_K117008
- Bba_K117008 #2 (from resuspending remaining part left in registry in 15 uL of ultra pure water)
- Bba_K117002
- Bba_K145001
- Bba_K103006
- Bba_I719005
- The cultures were allowed to grow in the incubator from 2:15-4:00pm
- The cultures started to clump after growing this time
- 100 uL of cells were plated on 100 mg/mL AMP plates
7/14/2010
Biobrick Transformation take 2
Ann
Electroporation Transformation
All of the transformation plates grew out! (minus the negative control of course)
This means we should do all transformations by electroporation from now on. Just check with the Lin Lab to make sure we can use the electroporation machine for a few hours before starting
Miniprep
- Started overnight cultures in 5 mL of LB plus 100 mg/mL AMP
- The following biobricks were started from the transformation plate
- Bba_K117008
- Bba_K117002
- Bba_K145001
- Bba_K103006
- Bba_I719005
- The following biobricks were started from the frozen stock in the -80C freezer
- BBa_K719015
- The following biobricks were started from the transformation plate
INPNC Biobrick part
- We received the INPNC biobrick (Bba_K265008) from UC Davis 2009 team. THANK YOU!!!
- It was shipped on LB plates in a pMA-SK plasmid from Mr. Gene in E. coli DH5alpha
- Since this plasmid has AMP antibiotic resistance I am pouring plates today with Marc and Kevin with 100 mg/mL AMP resistance to streak out the culture tomorrow with Josh
7/25/2010
Biobrick Transformation of suface display and pBAD
Ann
Tonight I started an 8mL culture of E. coli DH5alpha in LB broth and place in the 30C shaker to grow out overnight
7/26/2010
Biobrick Transformation of suface display and pBAD
Ann
Electroporation transformation
Started larger culture for comp cell preparation in 40mL of LB in a 500 mL sterile container at 9:00am
At 11:30am the OD of the culture was 0.730 and the cultures were placed on ice
The transformation of the biobricks was performed for according to the electroporation transformation protocol listed under the protocol section
The biobricks removed from the registry are as follows
- E0040 (GFP)
- K157013 (linker)
- I0500 (pBAD)
The miniprep of I79015 was used as a positive control and a negitive control was also run
The OD600 of the comp cells were not measured
All of the time constants for the transformation were above 5
the GFP, linker parts and the positive and negitive control were plated on 100 mg/mL AMP plates. The pBAD part and negitive control were plated on 50 mg/mL KAN
7/27/2010
Biobrick Transformation of suface display and pBAD
Transformation Results
The GFP and linker transformation worked and many colonies grew out on the 100 mg/mL AMP plates
The pBAD part did not grow out on the KAN plates. Upon further inspection this plasmid needs to be grown with IPTG to switch the origin of replication to a high copy above 100 copies per cell. Otherwise, another orgin of replication dominates that is less than 10 copies per cell and the antibiotic concentration of 50 mg/mL maybe too high. This transformation will have to be tried again
Miniprep of surface display
At 9:00am a 5 mL culture of the newly transformed GFP part, the newly transformed linker part, the ompA part transformed previously and the INP from the UC davis team were started for a miniprep in LB with 100 mg/mL AMP.
The modified miniprep protocol was used listed on the protocol section of the wiki to get a higher DNA concentration
At 9:00pm the GFP, linker and INP parts were miniprepped. The ompA culture had not grown out (b/c not enough -80C freezer stock was added) and a new culture was restarted at 11:00pm in 5 mL of LB with 100 mg/mL AMP.
Pouring Plates
More LB with 100 mg/mL AMP plates and LB with 25 mg/mL KAN plates were poured
7/28/2010
OmpA Miniprep
The OmpA culture grew out and was miniprepped according the the modified miniprep protocol at 11:30am
Nanodrop of surface display parts
The minipreped cultures from yesterday were nanodropped to determine the DNA concentration according to the protocol in the protocol section of the wiki
- GFP: 47.8 ng/uL
- linker: 33.2 ng/uL
- INP: 41.8 ng/uL
- OmpA: 49.3 ng/uL
Digest of surface display parts
The following biobricks were digested according to the protocol on the wiki with the enzymes listed below
- GFP 1: XbaI and PstI
- GFP 2: EcoRI and XbaI
- INP 1: EcoRI and SpeI
- INP 2: SpeI and PstI
- Linker 1: XbaI and PstI
- Linker 2: SpeI and PstI
- OmpA 1: EcoRI and SpeI
- OmpA 2: SpeI and PstI
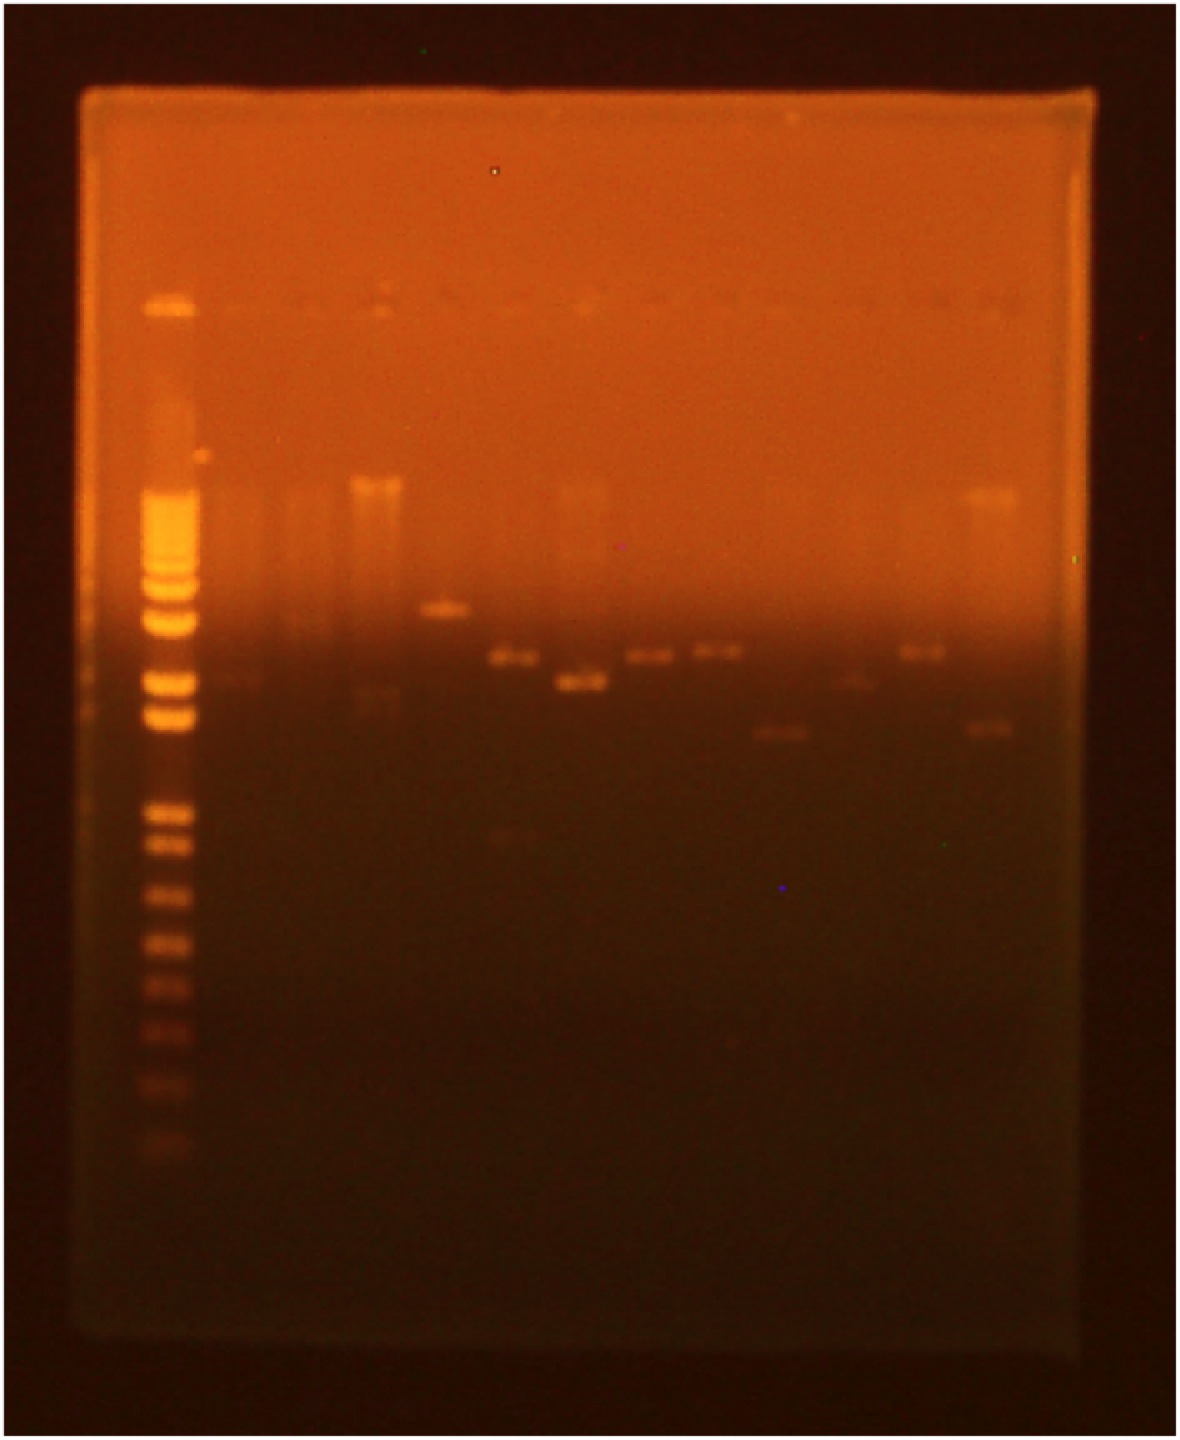
Gel of Digest for surface display parts
A gel was run of the above digest with uncut plasmid as a control
- Lane 1: invitrogen 1 kb plus ladder
- Lane 2: GFP cut with XbaI and PstI (GFP: 720 bp Backbone: 2079 bp)
- Lane 3: GFP cut with EcoRI and XbaI
- Lane 4: uncut GFP plamid
- Lane 5:INP cut with EcoRI and SpeI (INP: 924 bp backbone: 2550 bp)
- Lane 6:INP cut with SpeI and PstI
- Lane 7:uncut INP plasmid
- Lane 8:Linker cut with XbaI and SpeI (Linker: 45 bp backbone: 2428 bp)
- Lane 9:Linker cut with SpeI and PstI
- Lane 10: uncut Linker plasmid
- Lane 11: OmpA cut with EcoRI and SpeI (OmpA: 464 bp backbone: 2079 bp)
- Lane 12: OmpA cut with SpeI and PstI
- Lane 13:uncut OmpA plasmid
7/29/2010
Biofilm Assay in LB media
Started cultures of E. coli K12, P. putida (oilsands) and P. fluorescens (oilsands) in 2 mL of LB and grew in the 30C shaker overnight
7/30/2010
Biofilm Assay in LB media
Today we carried out the following biofilm assay protocol
- @ 8:10am the cultures were started from the overnight
- @ 10:00am the OD600 of each culture was measured to be
- E. coli K12: 0.8
- P. fluorescens: 1.2
- P. putida: 1.0
- These cultures were overgrown but still used for the experiment
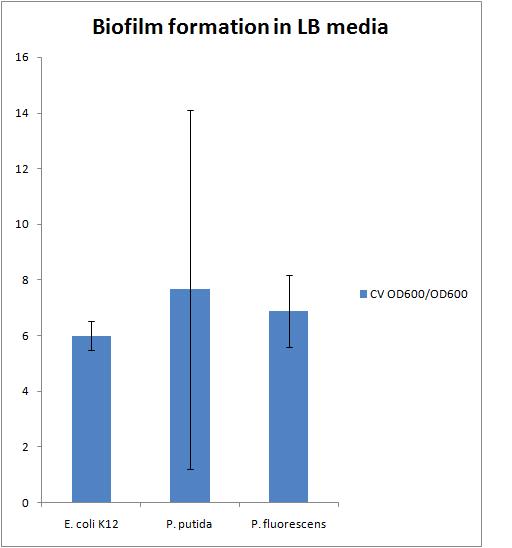
The results of this experiment are presented in the chart below
There is a large error in the P. putida strain because there was the largest variation in the OD 600 of the liquid culture which also resulted in a large variation in the CV OD 600 reading
We need to find a reference to compare our biofilms to. This could be either a strain that does not form biofilms or a strain that forms biofilms very well
Transformation of pBAD
Marcus and Alex tried the transformation of pBAD again according to the electroporation protocol with Ann's Notes
The recovery after electroporation was performed in 1 mL of LB with 1mM of IPTG added in order to have the pBAD part have a high copy number
30 uL of 1M IPTG solution was added to a 25 mg/mL KAN plate and spread with sterile beads in order to keep the high copy plasmid in the pBAD part while plating
7/30/2010
Transformation of pBAD
The transformation was successful and there were about 30 colonies on the plate. One colony was picked at 7:30 pm for a miniprep the next day and added to 5mL of LB + 25 mg/mL KAN + 1 mM IPTG and grown out in the 30C shaker
Another culture was started of GFP from the -80C freezer stock in 5 mL of LB + 100 mg/mL AMP for a miniprep. Both the ligations with GFP did not work, so as long as we are miniprepping and digesting we want to re-verify this part
8/1/2010
Nanodrop of pBAD and GFP verification
The miniprep was performed for the two cultures started last night according the the MODIFIED miniprep protocol. A frozen stock was made of the pBAD biobrick and placed in the -80C freezer
The DNA concentrations reported by the nanodrop are as follows
- pBAD: 386 ng/uL (260/280=2.02 and 260/230=2.32)
- GFP: 25.8 ng/uL (260/280=2.22 and 260/230=2.72)
The pBAD grew out very dense and when IPTG is added the copy number is over 100 so the DNA concentration was very high
Digest of pBAD and GFP verification
The parts were digested according to the protocol in the protocol section of the wiki for a 50 uL reaction volume
- GFP #3 was digested with XbaI and PstI
- GFP #4 was digested with EcoRI and XbaI
- pBAD #1 was digested with EcoRI and SpeI
- pBAD #2 was digested with SpeI and PstI
8/2/2010
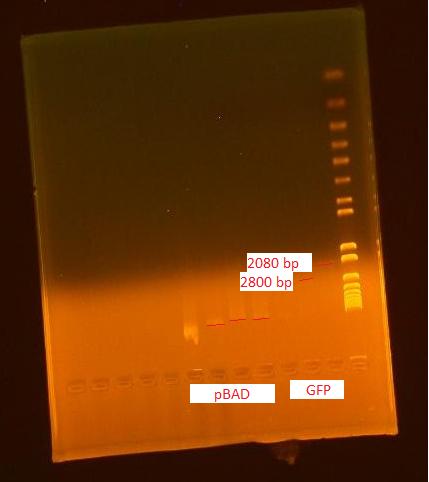
Gel of Digested Parts
- Lane 1: invitrogen 1 kb plus ladder
- Lane 2: GFP #3 cut with XbaI and PstI (GFP: 720 bp Backbone: 2079 bp)
- Lane 3: GFP #4 cut with EcoRI and XbaI
- Lane 4: uncut GFP plamid (only 1 uL left so did not show up on gel)
- Lane 5: pBAD cut with EcoRI and SpeI(pBAD: 1210 bp backbone: 4425 bp)
- Lane 6: pBAD cut with SpeI and PstI
- Lane 7: uncut pBAD (loaded very small amount into gel by accident)
- Lane 8: uncut pBAD (loaded 1 uL of miniprep into gel)
We did not get the pBAD part potentially because the miniprep culture overgrew and the cells started to lyse their chromosomal DNA (resulting in extremely long bands in the gel). We will try miniprepping the DNA from this culture again letting the culture grow out for a shorter amount of time before the miniprep
flu primers
Primers were ordered today to amplify the flu operon of E. coli K12 by colony PCR
8/3/2010
Minimal Media Recipes
Minimal media was mixed today according to the following recipes (also found in the media recipe section of the notebooks)
Culturing Bacteria in Naphthenic Acids (NA's)
The following 9 cultures were started to test bacteria growth in NA media
- Negitive Control (to make sure all strains grow in this minimal media)
- E. coli K12 in Bushnell-Haas minimal media supplemented with glucose
- P. putida oil sands in Bushnell-Haas minimal media supplemented with glucose
- P. flourescens oil sands in Bushnell-Haas minimal media supplemented with glucose
- NA media
- E. coli K12 in Bushnell-Haas minimal media supplemented with cyclohexane carboxylic acid (120 mg/L concentration)
- P. putida oil sands in Bushnell-Haas minimal media supplemented with cyclohexane carboxylic acid (120 mg/L concentration)
- P. flourescens oil sands in Bushnell-Haas minimal media supplemented with cyclohexane carboxylic acid (120 mg/L concentration)
- pH adjusted NA media
- E. coli K12 in Bushnell-Haas minimal media supplemented with cyclohexane carboxylic acid (120 mg/L concentration) pH adjusted between 8 and 9
- P. putida oil sands in Bushnell-Haas minimal media supplemented with cyclohexane carboxylic acid (120 mg/L concentration)pH adjusted between 8 and 9
- P. flourescens oil sands in Bushnell-Haas minimal media supplemented with cyclohexane carboxylic acid (120 mg/L concentration)pH adjusted between 8 and 9
1 mL of the above media was added to a 15 mL falcon tube and innoculated with -80C freezer stock of each culture and grown in the 30C shaker (psuedomonas strains are temperature sensitive). The cultures were started at 7:30 pm
8/4/2010
Culturing Bacteria in Naphthenic Acids (NA's)
At 12:30 pm the OD600 of the cultures started yesterday were measured and are listed below. These results must be taken with a grain of salt because the cultures were started from the -80C freezer stock with different amounts of innoculum
- P. putida BH-glu: 0.244
- P. putida BH-CHCA: 0.0245
- P. putida BH-CHCA pH 9: 0.033
- P. flourescens BH-glu: 0.396
- P. flourescens BH-CHCA: 0.219
- P. flourescens BH-CHCA pH9: 0.417
- E. coli K12 BH-glu: 0.017
- E. coli K12 BH-CHCA: 0.016
- E. coli K12 BH-CHCA pH9: 0.0325
P. flourescens oilsand seems to love this medium and grew out very dense! P. putida oilsand showed signs of starting to grow. E. coil K12 did not grow at all and dead cells pellets appeared on the bottom of the culture flask
From these results we can go ahead and start cultures for the biofilm assay experiment, and time the cultures so they all become dense on around the same day. If all cultures are started 24 hours in advanced they all should saturate by the next day.
The E. coli K12 and P. putida oilsands cultures were placed back in the 30C shaker to keep growing. By 9:30pm the P. putida oilsands cultures had saturated and the E. coli K12 cultures had still not grown
As a control for the biofilm assay E. coli K12 will be grown in M9 minimal media with glucose as a carbon source with and without casamino acids. We will not attempt to grow E. coli K12 in Bushnell-Haas media.
Measuring pH of Bushnell-Haas minial media with cyclohexane carboxylic acid adjusted to pH 9
Today Marc showed us how to use the pH meter in the Lin Lab. Yesterday the pH of the media was estimated by pH paper to be between 8 and 9. The actual pH of the media is 7.35. The pH of the already adjusted media from yesterday was increased by added more 250 uL of 0.1 M NaOH to 5mL of BH CHCA media and the pH ready 7.6 using the pH probe. Another 250 uL of NaOH was added to this mixutre and the pH read 8.8 using the pH probe. pH paper was dotted using this mixture to see the exact color it should turn when the pH is close to 9 (the paper looks more blue than green when the dot first appears).
A more concentrated NaOH sterilized stock solution needs to be made so when NaOH is added to the media the salts are not diluted
Bacterial Growth in pH of 9
After determining that 1mL of the supposedly adready adjusted BH-CHCA media needed 100 uL of 0.1 M NaOH soultion per mL to really be close to a pH of 9, new overnight cultures were started of the two pseudomonas oilsand strains in the 1 mL of the BH-CHCA pH adjusted media from yesterday adding an additional 100 uL of 0.1 M NaOH. These two cultures were placed in the 30C shaker to grow out overnight at 8:30 pm.
Miniprep of pBAD take 2
At 10:45 pm a 5 mL culture of the pBAD biobrick was started from the -80C freezer stock in LB + 25 mg/mL KAN + 1 mM IPTG for a miniprep tomorrow morning
PCR of flu operon of E. coli K12
The primers ordered on Monday came in today!
PCR reagents were picked up from the life science store
- dNTP's
- These dNTP's came in four seperate containers individually in a 100 mM solution. The following recipe was used to make the 10 mM dNTP mixture
- 100 uL of 100 mM dATP
- 100 uL of 100 mM dTTP
- 100 uL of 100 mM dGTP
- 100 uL of 100 mM dCTP
- 600 uL of ultra pure water
- These dNTP's came in four seperate containers individually in a 100 mM solution. The following recipe was used to make the 10 mM dNTP mixture
- Phusion High Fidelity Polymerase
- comes with buffer
- used to amplify long pieces of DNA
- 50 rxn PCR purification kit
The PCR was run according to the following colony PCR protocol
The final annealing cycle for 10 minutes at 72 C was accidentally added in the last 30 cycle loop. This mistake was caught after 3 cycles and the PCR was stopped, the program fixed and the reaction restarted.
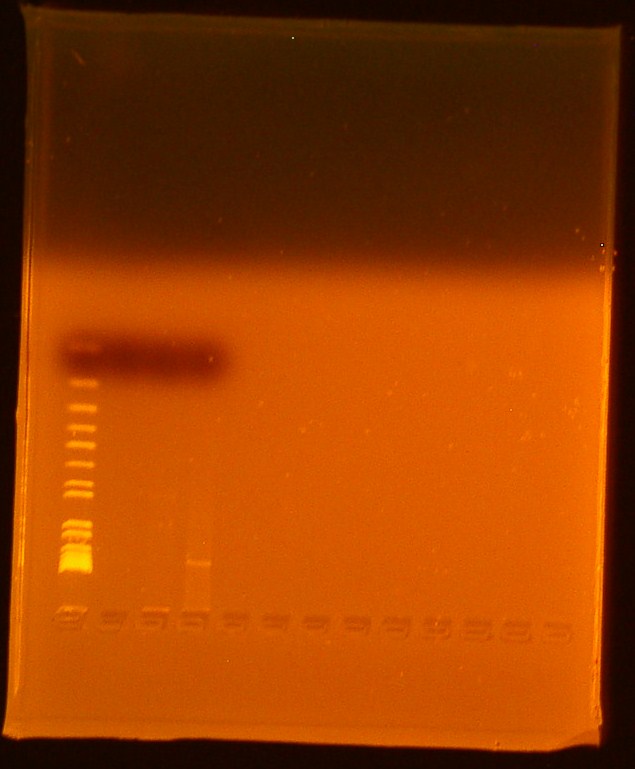
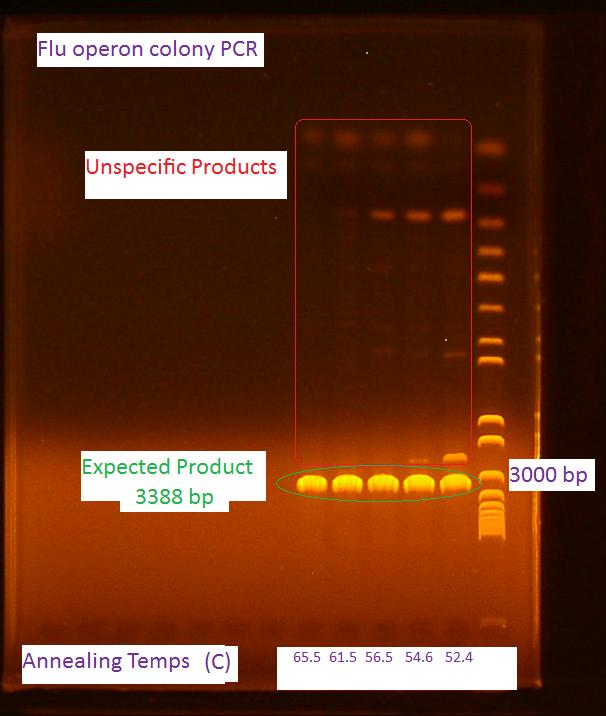
Gel of flu colony PCR
The following gel was run in a 0.7% agarose gel at 85V according to the protocol on the wiki
For the first 5 cycles the annealing temperature was lowered to the Tm of the 16 or 18 bp that was complementary to the E. coli K12 template. A gradient of temperature was run for the annealing temperatures of the first five cylces as labeled in the gel
8/5/2010
Bacterial Growth at pH 9
At 9:00am the two cultures started in the BH-CHCA with the pH actually adjusted to around 9 was checked. Both P. putida oilsands and P. fluorescens oilsands showed slight signs of growth. Later in the day at3:30 pm the cultures are denser were denser and the OD600 of the culture is:
- P. putida oilsands: 0.065
- P. fluorescens oilsands: 0.433
It should be noted some of the salts precipitated out of solution in the 1 mL cultures
Miniprep of pBAD take 2
The miniprep was started at 8:45am. After 10 hours of growth the culture was saturated and the miniprep started according to the modified miniprep protocol.
Nanodrop of pBAD take 2
The concentration of the pBAD promoter miniprepped earlier today is 418 ng/uL. It is most likely still contaminated with this high concentration but we will digest it and run a gel to check anyways
Digest of pBAD take 2
the digest was performed according to the digest protocol in the protocol section of the wiki
pBAD #3 was digested with EcoRI and SpeI pBAD #4 was digested with SpeI and PstI
PCR of flu operon
The PCR of the flu operon was repeated 3 more times at higher annealing temperatures because this showed to have less unspecific product (shown by the gel from yesterday)according to this modified colony PCR protocol. The volume of the reactions were increased to 50 uL to do a PCR purification step afterwards.
Gel of flu operon PCR and pBAD promoter digest
The gel ran exactly the same for the pBAD promoter as on 8/2/2010. The sample is probably contaminated and a new colony should be picked from the transformation plate and screened.
Also, no bands appeared for the flu PCR. One error might be because we did not include an initial cell lysis step. The PCR will be tried again tomorrow
Biofilm assay in minimal media
Cultures were started according to the following biofilm assay protocol to inoculate the microplate for the biofilm assay tomorrow.
8/6/2010
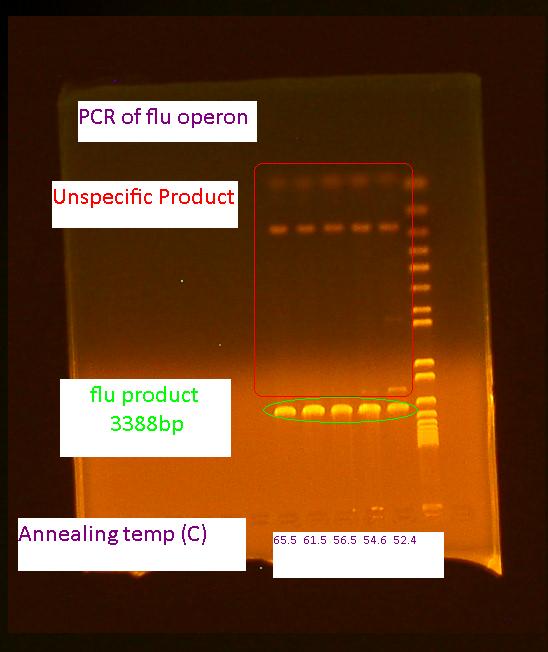
PCR of flu take 3
The first PCR of the flu operon was repeated with an added cell lysis step according to the following modified protocol
Gel of PCR of flu take 3
Invitrogen 1 kb plus ladder
Due to the unspecific product the flu operon will be purified with gel purification
Biofilm Assay
The OD600 of the cultures started yesterday are listed below along with the volume for resuspension after 1 mL of culture was pelleted:
| OD600 | Volume for resuspension (uL) | |
| E. coli K12 LB | 0.914 | 228 |
| P. putida KT2440 LB | 1.168 | 292 |
| P. putida oilsands LB | 1.119 | 280 |
| P. fluorescens oilsands LB | 1.283 | 321 |
| E. coli K12 M9 minimal media plus glucose | 0.391 | 98 |
| P. putida KT2440 Bushnell-Hass media plus glucose | 0.545 | 136 |
| P. putida oilsands Bushnell-Hass media plus glucose | 0.385 | 96 |
| P. fluorescens oilsands Bushnell-Hass media plus glucose | 0.504 | 126 |
| E. coli K12 M9 minimal media plus glucose plus casamino acids | 0.814 | 204 |
| P. putida KT2440 Bushnell-Hass media plus glucose plus casamino acids | 1.185 | 296 |
| P. putida oilsands Bushnell-Hass media plus glucose plus casamino acids | 1.121 | 280 |
| P. fluorescens oilsands Bushnell-Hass media plus glucose plus casamino acids | 1.191 | 298 |
| P. putida KT2440 Bushnell-Hass media plus cyclohexane carboxylic acid | 0.0345 | 8.6 |
| P. putida oilsands Bushnell-Hass media plus cyclohexane carboxylic acid | 0.144 | 36 |
| P. fluorescens oilsands Bushnell-Hass media plus cyclohexane carboxylic acid | 0.197 | 49 |
| P. putida KT2440 Bushnell-Hass media plus cyclohexane carboxylic acid pH9 | 0.034 | 8.5 |
| P. putida oilsands Bushnell-Hass media plus cyclohexane carboxylic acid pH9 | 0.002 | 0.06 |
| P. fluorescens oilsands Bushnell-Hass media plus cyclohexane carboxylic acid pH9 | 0.199 | 49.8 |
Not all of the cultures grew out (P. putida KT2440 Bushnell-Haas media plus cyclohexane carboylic acid, P. putida KT2440 Bushnell-Haas media plus cyclohexane carboylic acid pH 9, P. putida oilsands Bushnell-Haas media plus cyclohexane carboxylic acid pH 9) The modified bio assay protocol was used to inoculate the microplate
The microplate was inoculated at 4:30pm
8/8/2010
The washing and CV staining of the bioassay was performed according to the modified protocol on 8/6/2010
The OD 600 of the plate after the bioassay growth is shown in the following graph
The Crystal Violet OD 600 after staining is show in the following graph
The Crystal Violet OD 600 to OD 600 after growth ratio is shown in the following graph
 "
"

