Team:TU Delft/27 July 2010 content
From 2010.igem.org
(→Alkane degradation) |
(→RBS Characterization) |
||
| Line 93: | Line 93: | ||
[[Image:26_07_2010_Rbs.png]] | [[Image:26_07_2010_Rbs.png]] | ||
| - | Strength was calculated by taking the mean of the ratio between the expression of known RBS ([http://partsregistry.org/Part:BBa_B0032 B0032]) and expression Anderson RBS over some time. Expression being the measured fluorescence divided by measured biomass (absorbance, OD). | + | Strength was calculated by taking the mean of the ratio between the expression of known RBS ([http://partsregistry.org/Part:BBa_B0032 B0032]) and expression of Anderson RBS over some time. Expression being the measured fluorescence divided by measured biomass (absorbance, OD). |
The measurements where taken from the part of the curve where optimal growth can be assumed, so from 0:40 until 2:30 | The measurements where taken from the part of the curve where optimal growth can be assumed, so from 0:40 until 2:30 | ||
Revision as of 21:54, 28 July 2010
Alkane degradation
Yesterday's digestion products were checked on a gel.
| # | Lane description | As expected? |
| 1 | SmartLadder (5μl) | |
| 2 | rubA3 (cut) | ✓ |
| 3 | rubA3 (uncut) | ✓ |
| 4 | rubA4 (cut) | ✓ |
| 5 | rubA4 (uncut) | ✓ |
| 6 | rubR (cut) | ✓ |
| 7 | rubR (uncut) | ✓ |
| 8 | ladA (cut) | ✓ |
| 9 | ladA (uncut) | ✓ |
| 10 | ADH (cut) | ✓ |
| 11 | ADH (uncut) | ✓ |
| 12 | ALDH (cut) | ✓ |
| 13 | ALDH (uncut) | ✓ |
| 14 | J61100 (cut) | ✓ |
| 15 | J61100 (uncut) | ✓ |
| 16 | J61101 (cut) | ✓ |
| 17 | J61101 (uncut) | ✓ |
| 18 | J61107 (cut) | ✓ |
| 19 | J61107 (uncut) | ✓ |
Transformation
The ligation mixes were incubated overnight. We transformed 10 μL of these ligations in Top10 competent cells
RBS Characterization
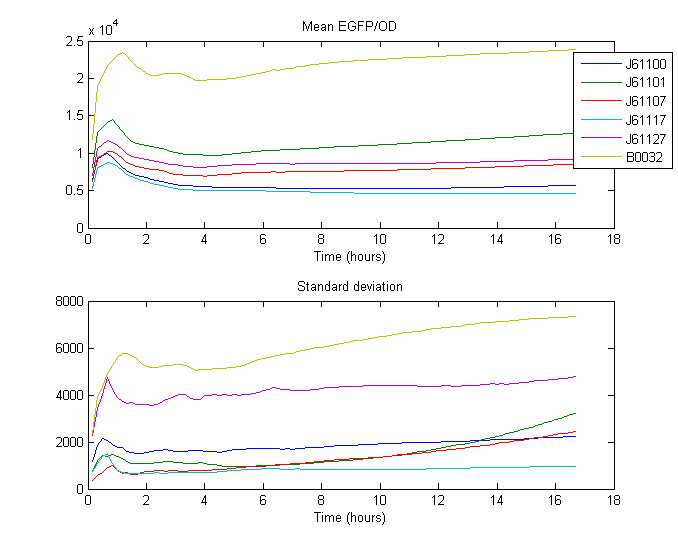
For our RBS characterization project, 5 different RBS sequences from the [http://partsregistry.org/Ribosome_Binding_Sites/Prokaryotic/Constitutive/Anderson Anderson RBS family] where placed in front of GFP and measured over 18 hours using a Gen5 fluorenscence and absorbance plate reader

Strength was calculated by taking the mean of the ratio between the expression of known RBS ([http://partsregistry.org/Part:BBa_B0032 B0032]) and expression of Anderson RBS over some time. Expression being the measured fluorescence divided by measured biomass (absorbance, OD).
The measurements where taken from the part of the curve where optimal growth can be assumed, so from 0:40 until 2:30
| RBS | Strength |
| [http://partsregistry.org/Part:BBa_J61100 J61100] | 0.047513 |
| [http://partsregistry.org/Part:BBa_J61101 J61101] | 0.119831 |
| [http://partsregistry.org/Part:BBa_J61107 J61107] | 0.065454 |
| [http://partsregistry.org/Part:BBa_J61117 J61117] | 0.038518 |
| [http://partsregistry.org/Part:BBa_J61127 J61127] | 0.087334 |
| [http://partsregistry.org/Part:BBa_B0032 B0032] | 0.300000 |
Next step: We want to relate the RBS sequence to the strength, so it might be possible to say predict something about the other Anderson RBS sequences.
 "
"
