Team:Davidson-MissouriW/OptimizingCodons
From 2010.igem.org
Dwagnermwsu (Talk | contribs) (→Building Optimized and Deoptimized TetA) |
Dwagnermwsu (Talk | contribs) (→Building Optimized and Deoptimized TetA) |
||
| Line 16: | Line 16: | ||
[[Image:Davidson-MissouriWtetaconstruct.jpg | center]] | [[Image:Davidson-MissouriWtetaconstruct.jpg | center]] | ||
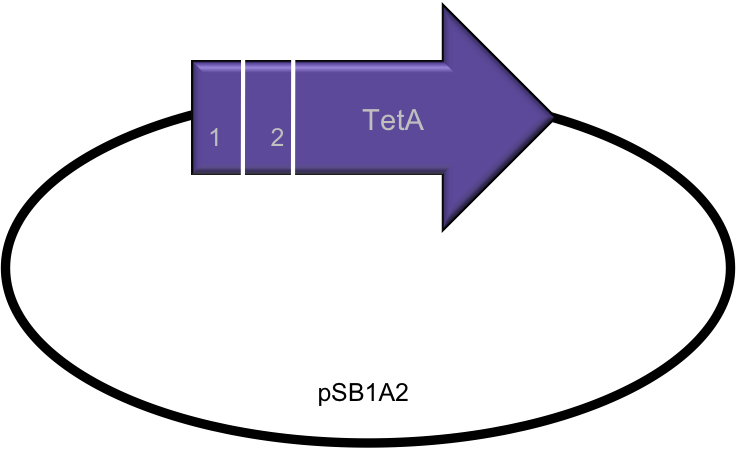
| + | This diagram demonstrates how the TetA gene was broken into different segments (1 and 2) and created on a pSB1A2 vector. | ||
<html><table style="word-break:break-all" border=1 cellpadding=2 valign="top"> | <html><table style="word-break:break-all" border=1 cellpadding=2 valign="top"> | ||
Revision as of 14:07, 28 July 2010
Contents |
Optimizing Codons
Introduction
- Using a variety of programs available online, including the [http://gcat.davidson.edu/igem10/index.html Oligator] and [http://gcat.davidson.edu/igem10/opt/opt_index.html Optimoose], we were able to formulate a plan that would enable us to synthesize various optimized and deoptimized versions of the TetA gene. We relied on codon bias, the differences in frequency of occurrence of synonymous codons in coding DNA, to allow for varying expression levels of TetA in the cell. By using natural enzyme sites within TetA, we were able to conduct restriction digests on TetA that allowed us to alter roughly 150 base pairs within each segment using codon bias with a total of four segments available. The TetA vector that was used to synthesize segment 1 clones was digested with EcoRI and NheI. The TetA vector that was used to synthesize segment 2 clones was digested with NheI and BamHI. This gave us the ability to insert roughly 144 bp for each segment that were optimized or deoptimized using codon bias. These inserts were fairly large and thus were synthesized by annealing oligos. These annealed oligos were then treated with a polynucleotide kinase to add a phosphate backbone to the oligo DNA. Initial results yielded a lot of background given that it was difficult to distinguish between singly and doubly cut vectors. Therefore, to reduce background noise, we added an extra step in our preparation of the vector using Antarctic Phosphatase. By using this phosphatase on the vector, we were able to remove the 5’ phosphate groups off the backbone of the DNA while still leaving the 3’ end phosphates. This made it difficult for the singly cut vector to go back on itself because ligase requires a phosphate group to be present to seal the nick in the phosphate backbone. With this reduced background, we were able to ligate the annealed oligos to our vectors and screen the candidate clones using RFLP.
Building Optimized and Deoptimized TetA
- To build the optimized and deoptimized segments of the Tet A gene we used the sequence that the [http://gcat.davidson.edu/igem10/opt/opt_index.html Optimoose] program gave us and put it into the [http://gcat.davidson.edu/igem10/index.html Oligator], a program created by the Davidson-Missouri Western iGEM team. After getting the recommended Oligo sequences, we added necessary "sticky ends" that were compatible with the naturally occurring restriction enzyme sites that we discovered (see Restriction Enzymes below). The Oligos that were ordered can be seen below.
This diagram demonstrates how the TetA gene was broken into different segments (1 and 2) and created on a pSB1A2 vector.
| Segment | Number of Base Pairs | Wild Type Sequence | Optimized Sequence | Deoptimized Sequence |
| 1 | 141 | ATGAAATCTAACAATGCGCTCATCGTCATCCTCGGCACCGTCACCCTGGATGCTGTAGGCATAGGCTTGGTTATGCCGGTACTGCCGGGCCTCTTGCGGGATATCGTCCATTCCGACAGCATCGCCAGTCACTATGGCGTG | ATGAAATCTAACAACGCGCTGATCGTTATCCTGGGTACCGTTACCCTGGACGCGGTTGGTATCGGTCTGGTTATGCCGGTTCTGCCGGGTCTGCTGCGTGACATCGTTCACTCTGACTCTATCGCGTCTCACTACGGTGTT | ATGAAGAGTAATAATGCCCTAATAGTCATACTAGGAACAGTCACACTAGATGCCGTCGGAATAGGACTCGTCATGCCCGTCCTACCCGGACTACTAAGGGATATAGTCCATAGTGATAGTATAGCCAGTCATTATGGAGTC |
| 2 | 138 | CTATATGCGTTGATGCAATTTCTATGCGCACCCGTTCTCGGAGCACTGTCCGACCGCTTTGGCCGCCGCCCAGTCCTGCTCGCTTCGCTACTTGGAGCCACTATCGACTACGCGATCATGGCGACCACACCCGTCCTG | CTGTACGCGCTGATGCAGTTCCTGTGCGCGCCGGTTCTGGGTGCGCTGTCTGACCGTTTCGGTCGTCGTCCGGTTCTGCTGGCGTCTCTGCTGGGTGCGACCATCGACTACGCGATCATGGCGACCACCCCGGTTCTG | CTATATGCCCTAATGCAATTTCTATGTGCCCCCGTCCTAGGAGCCCTAAGTGATAGGTTTGGAAGGAGGCCCGTCCTACTAGCCAGTCTACTAGGAGCCACAATAGATTATGCCATAATGGCCACAACACCCGTCCTA |
- Note: All above segments have been optimized and deoptimized using the [http://gcat.davidson.edu/igem10/opt/opt_index.html Optimoose] online program.
- Segment 1 Oligos
- Optimized
- top 1 5' AATTCGCGGCCGCTTCTAGATGAAATCTAACAACGCGCTGATCGTTATCCTGGGTACCG 3’
- top 2 5' TTACCCTGGACGCGGTTGGTATCGGTCTGGTTATGCCGGTTCTGCCGGGTCTGCTGCGTGAC 3’
- top 3 5' ATCGTTCACTCTGACTCTATCGCGTCTCACTACGGTGTTCTG 3’
- bottom 2 5' CATAACCAGACCGATACCAACCGCGTCCAGGGTAACGGTAC
- CCAGGATAACGATCAGCGCGTTGTTAGATTTCATCTAGAAGCGGCCGCG 3’
- bottom 1 5' CTAGCAGAACACCGTAGTGAGACGCGATAGAGTCAGAGTGAACGATGTCACGCAGCAGACCCGGCAGAACCGG 3’
- Deoptimized
- top 1 5' AATTCGCGGCCGCTTCTAGATGAAGAGTAATAATGCCCTAATAGTCATACTAGGAACAG 3’
- top 2 5' TCACACTAGATGCCGTCGGAATAGGACTCGTCATGCCCGTCCTACCCGGACTACTAAGGGA 3’
- top 3 5' TATAGTCCATAGTGATAGTATAGCCAGTCATTATGGAGTCCTG 3’
- bottom 2 5' GAGTCCTATTCCGACGGCATCTAGTGTGACTGTTCCTAGTATG
- ACTATTAGGGCATTATTACTCTTCATCTAGAAGCGGCCGCG 3’
- bottom 1 5' CTAGCAGGACTCCATAATGACTGGCTATACTATCACTATGGACTATATCCCTTAGTAGTCCGGGTAGGACGGGCATGAC 3’
- Segment 2 Oligos
- Optimized
- top 1 5' CTAGCCTGTACGCGCTGATGCAGTTCCTGTGCGCGCCGGTTCTGGGTGCGCTGTCTGAC 3’
- top 2 5' CGTTTCGGTCGTCGTCCGGTTCTGCTGGCGTCTCTGCTGGGTGCGACCATCGACTAC 3’
- top 3 5' GCGATCATGGCGACCACCCCGGTTCTGTG 3’
- bottom 1 5' GCGCACAGGAACTGCATCAGCGCGTACAGG 3’
- bottom 2 5' CCAGCAGAACCGGACGACGACCGAAACGGTCAGACAGCGCACCCAGAACCGGC 3’
- bottom 3 5' GATCCACAGAACCGGGGTGGTCGCCATGATCGCGTAGTCGATGGTCGCACCCAGCAGAGACG 3’
- Deoptimized
- top 1 5' CTAGCGCTATATGCCCTAATGCAATTTCTATGTGCCCCCGTCCTAGGAGCCCTAAGTG 3'
- top 2 5' ATAGGTTTGGAAGGAGGCCCGTCCTACTAGCCAGTCTACTAGGAGCCACAATAGAT 3'
- top 3 5' TATGCCATAATGGCCACAACACCCGTCCTATG 3'
- bottom 1 5' GGCACATAGAAATTGCATTAGGGCATATAGCG 3'
- bottom 2 5' TAGGACGGGCCTCCTTCCAAACCTATCACTTAGGGCTCCTAGGACGGG 3'
- bottom 3 5' GATCCATAGGACGGGTGTTGTGGCCATTATGGCATAATCTATTGTGGCTCCTAGTAGACTGGCTAG 3'
- Restriction Enzymes
- To insert the annealed Oligo segments that were created we had to digest the Tet A gene using naturally occurring enzyme restriction sites that did not exist in the rest of the gene or in the plasmid (pSBIA2).
Segment First Restriction Enzyme Second Restriction Enzyme 1 EcoRI NheI 2 NheI BamHI
RFLP (Restriction Fragment Length Polymorphism)
We used restriction fragment length polymorphism (RFLP) as a way to screen our candidate clones for our optimized and deoptimized versions of the TetA gene. RFLP is a laboratory technique whereby DNA is digested by restriction enzymes and the resulting DNA fragments are separated by gel electrophoresis. RFLP relies on a difference between two or more samples of homologous DNA molecules arising from differing locations of restriction sites. Using the program NEBcutter V2 from New England Biolabs, we were able to determine which restriction enzymes to use to screen for our various TetA candidate clones. Based on availability of restriction enzymes and the greatest variability of bands created, we choose four different restriction enzymes for the custom digestion of our candidate clones:
Optimized segment 1→ HinFI
Deoptimized segment 2→ DdeI
Optimized segment 2→ BsaWI
Deoptimized segment 2→ AccI
Using RFLP, we screened our clones and sent strong candidate clones, the ones that had diagnostic bands indicative of the desired clone, off for sequencing. After analyzing the sequencing data, we were able to conclude that RFLP is an excellent method for screening for clones, given that almost all of the clones sent off were correct.
TetA Toxicity
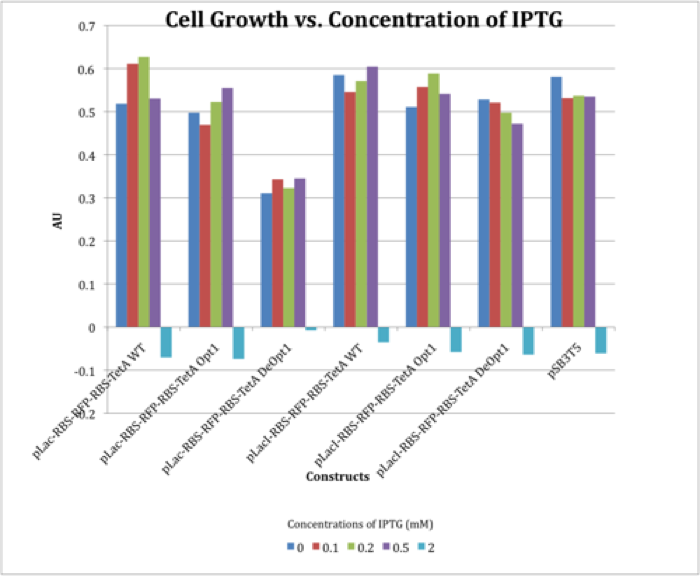
- This graph illustrates that a concentration of 2mM IPTG is lethal to the cell. pSB3T5 was a control in this experiment, for it has natural Tetracycline resistance. It can be seen that the deoptimized TetA gene did not provide as much Tet resistance as did the optimized and wild type TetA gene when behind a pLac promoter.
Tetracycline Experiments
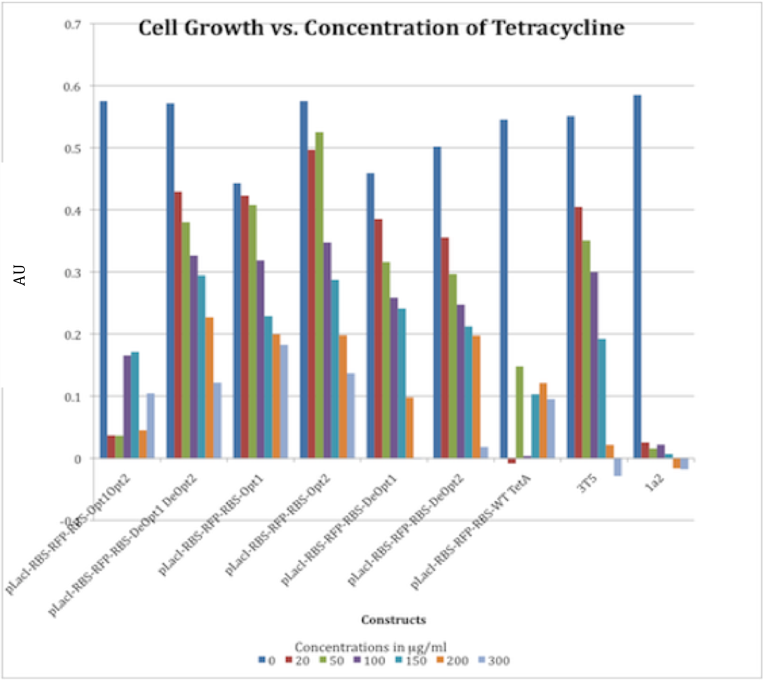
- The graph below illustrates that any amount of Tetracycline is toxic to the cell. With increasing concentrations of Tet, cell viability decreases.
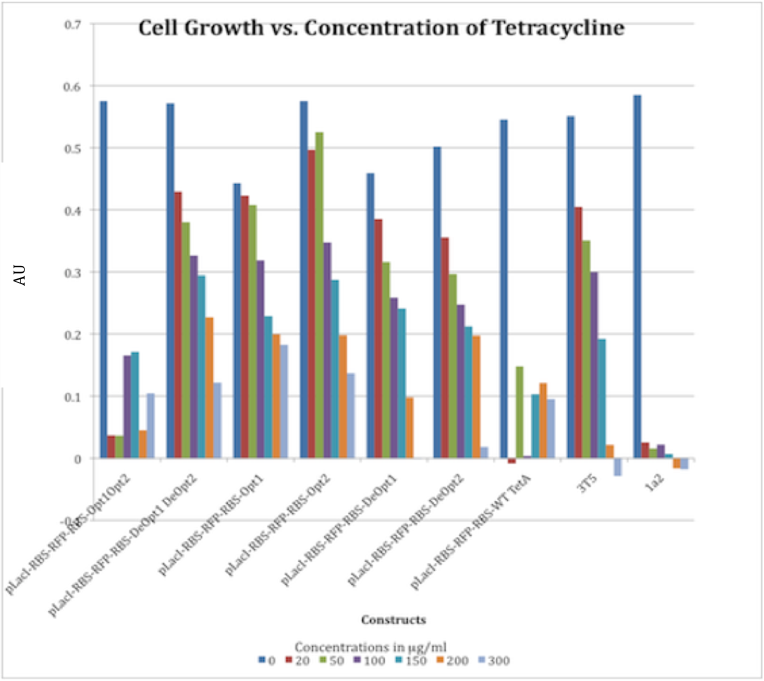
- The graph below illustrates that any amount of Tetracycline is toxic to the cell. With increasing concentrations of Tet, cell viability decreases. pSB1A2 was a control in this experiment which has no tetracycline resistant.
 "
"


