Team:Toronto/Modeling
From 2010.igem.org
| Line 94: | Line 94: | ||
| 9.822 | | 9.822 | ||
|- | |- | ||
| - | !scope="row"| EX_co2 | + | !scope="row"| EX_co2 |
| co2[e] <=> | | co2[e] <=> | ||
| NA | | NA | ||
| Line 129: | Line 129: | ||
| -1.708 | | -1.708 | ||
|- | |- | ||
| - | !scope="row"| EX_nh4 | + | !scope="row"| EX_nh4 |
| nh4[e] <=> | | nh4[e] <=> | ||
| NA | | NA | ||
| Line 136: | Line 136: | ||
| -2.193 | | -2.193 | ||
|- | |- | ||
| - | !scope="row"| EX_h | + | !scope="row"| EX_h |
| h[e] <=> | | h[e] <=> | ||
| NA | | NA | ||
| Line 143: | Line 143: | ||
| -3.116 | | -3.116 | ||
|- | |- | ||
| - | !scope="row"| EX_o2 | + | !scope="row"| EX_o2 |
| o2[e] <=> | | o2[e] <=> | ||
| NA | | NA | ||
| Line 156: | Line 156: | ||
<h3>'''Oxygen limitation and increasing catechol uptake'''</h3> | <h3>'''Oxygen limitation and increasing catechol uptake'''</h3> | ||
| - | < | + | <p> |
It is important to note that the uptake of catechol in our engineered strain of E. coli is predicted to be under oxygen limitation. For example, the OPT case of catechol degradation requires oxygen import at 20 mmol/gDW/h, which is the imposed maximum rate of oxygen transport. This value of oxygen transport limitation has been derived previously, and is an approximation of the diffusion rate based on the maximum concentration gradient of oxygen that can be achieved between the extracellular solution and cytosol. In vitro, sparging the experimental solution with oxygen gas may be required to ensure maximum oxygen available for transport to ''E. coli''. Furthermore, it may be possible to engineer the ''E. coli'' strain to increase catechol degradation through the incorporation of gene deletions. Due to the oxygen limitation observed in the OPT case, a genome-wide scan of single gene deletions optimizing for the minimization of metabolic adjustment (MOMA) did not turn up any that were predicted to increase catechol uptake (data not shown). However, algorithms to identify multiple gene deletions have been developed that can be applied to this problem. For example, the OptKnock (Burgard et al, 2003) procedure introduces a bilevel optimization approach where a cellular objective (e.g. biomass production) and a bioengineering objective (e.g. catechol degradation) can be optimized simultaneously. This method aims to identify gene deletions that will change the structure of the metabolic network so that the bioengineering objective becomes coupled to biomass production for the growing organism. As an extension of this work, OptStrain (Burgard et al, 2004) considers the addition of reaction pathways to the metabolic system that would increase the bioengineering objective. These procedures may be applied in future work to enhance the catechol degradation capability of the engineered ''E. coli'' strain. | It is important to note that the uptake of catechol in our engineered strain of E. coli is predicted to be under oxygen limitation. For example, the OPT case of catechol degradation requires oxygen import at 20 mmol/gDW/h, which is the imposed maximum rate of oxygen transport. This value of oxygen transport limitation has been derived previously, and is an approximation of the diffusion rate based on the maximum concentration gradient of oxygen that can be achieved between the extracellular solution and cytosol. In vitro, sparging the experimental solution with oxygen gas may be required to ensure maximum oxygen available for transport to ''E. coli''. Furthermore, it may be possible to engineer the ''E. coli'' strain to increase catechol degradation through the incorporation of gene deletions. Due to the oxygen limitation observed in the OPT case, a genome-wide scan of single gene deletions optimizing for the minimization of metabolic adjustment (MOMA) did not turn up any that were predicted to increase catechol uptake (data not shown). However, algorithms to identify multiple gene deletions have been developed that can be applied to this problem. For example, the OptKnock (Burgard et al, 2003) procedure introduces a bilevel optimization approach where a cellular objective (e.g. biomass production) and a bioengineering objective (e.g. catechol degradation) can be optimized simultaneously. This method aims to identify gene deletions that will change the structure of the metabolic network so that the bioengineering objective becomes coupled to biomass production for the growing organism. As an extension of this work, OptStrain (Burgard et al, 2004) considers the addition of reaction pathways to the metabolic system that would increase the bioengineering objective. These procedures may be applied in future work to enhance the catechol degradation capability of the engineered ''E. coli'' strain. | ||
</p> | </p> | ||
Revision as of 04:55, 29 November 2010
| Home | Project | Design | Protocols | Notebook | Results | Parts Submitted to the Registry | Modeling | Software Used | Human Practices | Safety | Team | Official Team Profile |
|---|
Contents |
Modeling
In silico prediction of metabolic response to catechol degradation in E. coli
In the following section we will investigate in silico predictions of metabolic flux distribution in our catechol degrading E. coli strain through Flux Balance Analysis (FBA). The analysis was performed using associated functions in the COBRA Toolbox. A previously developed genome-scale reconstruction of E. coli (iJR904) was altered to include a catechol transport reaction and a reaction representing the breakdown of catechol via the pathway specified in our design.
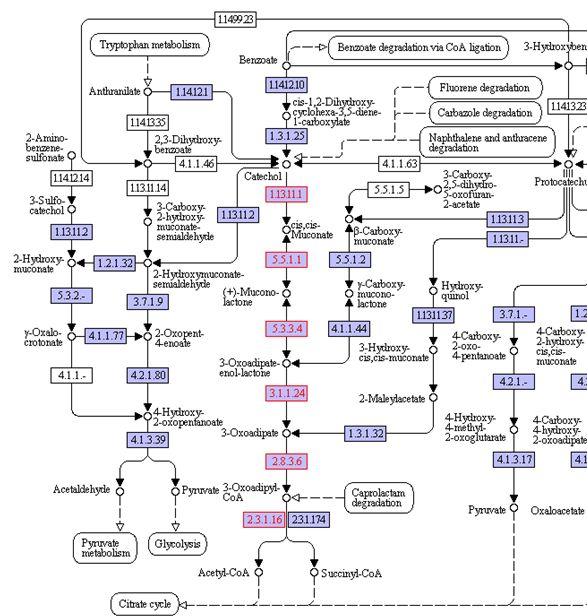
The catechol pathway that is inserted into E. coli is shown below. In the model, the catechol degredation pathway was represented with the grouped reaction:
Catechol + O2 + H2O + CoA --> Acetyl-CoA + Succinate
Since the enzymes EC: 1.13.11.1 and EC: 2.8.3.6 very likely catalyze irreversible reactions, the entire process was considered to be irreversible.
E. coli growth as a function of glucose and catechol uptake
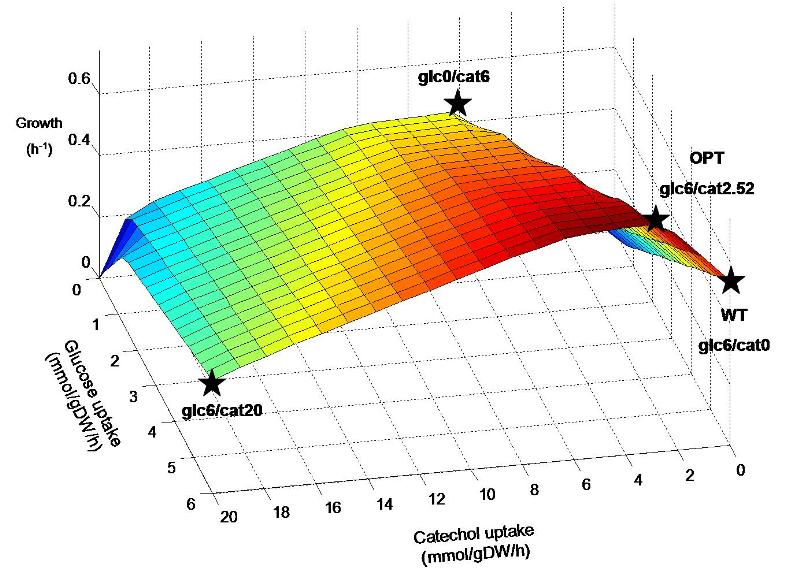
The inserted degradation pathway breaks down catechol into acetyl-CoA, which plays a central role in biochemical networks by serving as a connecting hub for many metabolic pathways. This enables the native organism, Pseudomonas putida, to use catechol as an alternate energy source to a certain extent and may also result in similar capability for our engineered E. coli strain. It is hypothesized that the combination of glucose and catechol that is taken up by the engineered strain may have a great affect on the flux distribution throughout the remaining metabolic network. Figure 1 shows predicted E. coli growth at various combinations of glucose and catechol uptake. Though experimentally determined transport rates of these energy sources are not yet available, we will do a preliminary analysis of the response to catechol uptake by investigating different points on the predicted metabolic landscape.
Figure 1. Predicted growth of E. coli at various uptake rates of glucose and catechol. The points specified on the surface are considered further in simulations. Points are named according to the uptake rate of glucose and catechol (eg. Glc6/cat0 corresponds to a glucose uptake of 6 mmol/gDW/h and catechol uptake of zero). Glc6/cat0 corresponds to a “wildtype” (WT) condition, while glc6/cat2.52 corresponds to the “optimal” (OPT) ratio predicted for by FBA to maximize biomass production. Glc0/cat6 and glc6/cat20 represent additional hypothetical situtions where catechol replaces glucose as an energy source, and where both are used at their maximum rates, respectively.
The predicted optimal uptake of catechol through FBA of the E. coli metabolic model is 2.52 mmol/gDW/h, resulting in a growth rate of 0.744 h-1. This is a prediction of the optimal catechol input into the metabolic system in order to produce the maximum amount of biomass components, taking into account the steady-state balancing of all associated metabolic compounds and cofactors. Though prediction of metabolic flux and microbial growth rate has been shown to be generally accurate through this method, experimental usage of catechol may be significantly higher or lower than the purely stoichiometric prediction. This is because the input of catechol into the metabolic network in vivo may trigger metabolic regulation at the expense of the assumed cellular objective (biomass production). Thus, the rates of catechol and glucose uptake are good candidates to be experimentally measured, and then set as constraints in model simulations. Subsequently, FBA simulations can be used to study the remaining associated metabolic fluxes in our E. coli strain through stoichiometric balancing.
Furthermore, even at a given combination of glucose and catechol uptake rate, there is a degree of variability associated with the in silico prediction of internal metabolic fluxes. FBA solutions are not unique, meaning that some reactions in the network can mathematically take more than one flux value for any given value of the network objective. Thus, it will likely be useful to get additional information about in vivo metabolic activity through the measurement of additional transport fluxes and/or upregulation of enzymes through transcriptomics procedures. This will serve to shrink the mathematical solution space (through the formation of additional constraints in FBA simulations) and narrow down the possible flux distributions towards those that are actually adapted by the E. coli in vivo. However, in this study we will consider the changes in predicted metabolic reaction variability in order to gain insight into the metabolic response to different combinations of glucose and catechol uptake. Specifically, we will investigate network variability at the four points indicated on Figure 1, each of which represent significantly different combinations of glucose and catechol uptake.
Metabolic reaction flux variability in different growth conditions
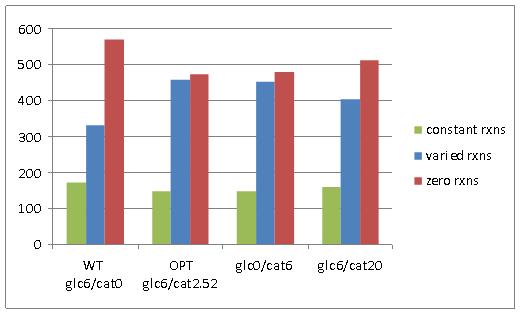
Network reactions were classified into three categories based on their predicted possible flux range at optimal E. coli growth (Figure 2A); constant reactions (reaction with flux value greater than 1e-5, and that do not have range of variability greater than 1e-5), varied reactions (reactions with a flux value greater than 1e-5, and that have a variability range greater than 1e-5), and zero reactions (reactions with a flux value less than 1e-5). In physiological terms, constant reactions represent areas of the metabolic network that must be active for optimal growth, varied reactions represent areas of the network that have flexibility in their activity, and zero reactions represent areas of the network that are essentially “turned off” for optimal growth.
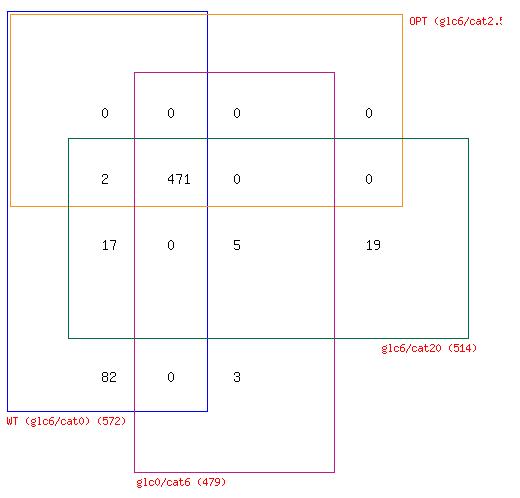
Figure 2. A) Reaction variability in E. coli at four different combinations of glucose and catechol uptake. B) Comparison of zero reactions across all four simulated growth combinations.
Comparison of the number of network reactions that fall into the three variability categories in different conditions reveals some trends in response to catechol uptake. For one, we notice that all three cases that have at least some catechol transport into E. coli (OPT, glc0/cat6, and glc6/cat20), have less zero reactions than the WT optimal flux distribution (Figure 2A). Furthermore, a four-way Venn diagram of the zero reactions in each case reveals that a large number are common to all cases (471) and a significant portion (82) are zero reactions in the WT case, but are active in all other cases with catechol uptake (Figure 2B). The extreme case of glc6/cat20 results in the greatest number of unique zero reactions (19), but this is generally not observed among the cases with catechol uptake. Taken together these results indicate that the transport of catechol into E. coli activates portions of the metabolic network that are predicted to have zero flux during growth on glucose. However, the set of reactions that is activated does not show significant change at different combinations of glucose and catechol.
Comparison of metabolic flux distribution between WT and OPT growth combinations
Though further analysis of the reaction variability data could be carried out for each of the hypothesized growth scenarios, here we will take a more detailed look at predicted change in metabolic reaction flux in the WT and OPT cases. This represents the change in metabolic reaction activity when E. coli is growing on a combination of glucose with slight catechol supplementation, as compared to E. coli growih using solely glucose. It was found that many of the reactions distributed into the three variability categories in the previous section had extremely minute fluxes. Thus, in order to highlight only significant changes in the metabolic network as a result of catechol uptake, we changed our reaction classification definitions to consider a higher tolerance.
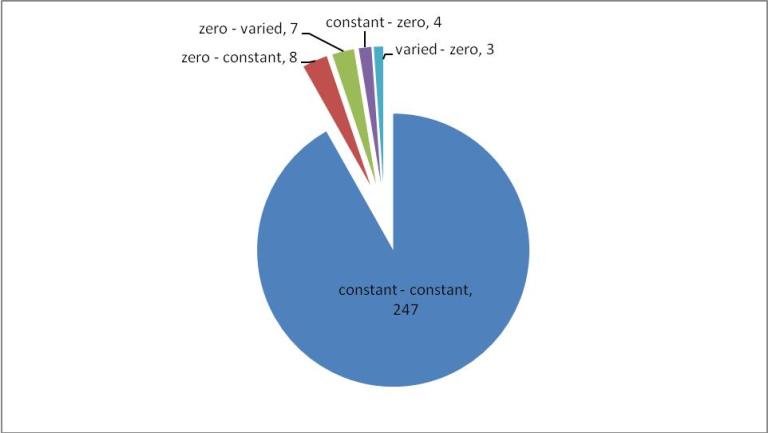
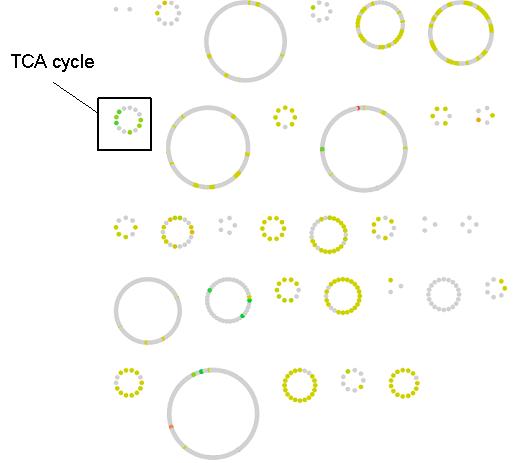
All reactions that have a predicted change in flux between the WT and OPT conditions are classified according to their change in flux variability status in Figure 3. Many of the reactions go from one constant value to another (247/271). Of the the remaining changing reactions, more are predicted to go from zero to either a constant or varied flux (15/271) as compared to a constant or varied flux to zero (7/271), which indicates that overall there is more activation of network reaction in the OPT case. The magnitude of flux change across the metabolic network is mapped in Figure 4. Most reactions have moderate change in flux value (yellow nodes), however a small percentage of reactions have a large change (green and red nodes). As a pathway, the reactions of the TCA cycle have a greater flux in the OPT case as a result of the increased presence of acetyl-CoA from catechol degradation. Reactions with the greatest positive change in flux and negative change in flux are listed in Table 1. However it important to note that the distinction between positive/negative changes in flux does not necessarily correlate to increased/decreased metabolic flux. Reactions that adopt a negative flux in the WT distribution (such as reversible reactions and transport reactions) and have a larger magnitude negative flux in the OPT distribution will be classified a negative change even though the flux through those metabolic processes has increased. For example, the oxygen transport reaction EX_o2(e) has flux of -12.57 in the WT distribution, and a flux of -20 in the OPT distribution. This indicates that a greater amount of oxygen is imported in the OPT case even though the reaction has a negative flux change.
Figure 3. Breakdown of reactions predicted to have a change in flux in the WT and OPT optimal flux distributions. Constant reactions are those have a flux variability less than 1e-2, varied reactions that have a range of fluxes greater than 1e-2, and zero reactions are those that have fluxes less than 1e-3. Groups are named according to their status in the WT and OPT flux predictions, respectively. For example, the "zero – constant" group represents reactions that are zero in the WT distribution and constant in the OPT distribution.
Figure 4. Flux change between the WT and OPT optimal distributions across the E. coli metabolic network. Reactions are represented as nodes and grouped according to their defined pathway in the iJR904 model. The change for variable reactions was calculated by considering the average point within its flux range. Reactions with a significant flux change are shown in red and green while slight changes are shown in yellow. Grey nodes represent reactions without a change in predicted metabolic flux. Flux change and pathway for each reaction node can be obtained from the following cytoscape file.
Table 1. Top five reactions with the greatest positive and negative flux change in the WT and OPT optimal distributions.
RID Reaction Gene WT flux OPT flux Difference ATPS4r adp[c] + 4.000000 h[e] + pi[c] <=> atp[c] + h2o[c] + 3.000000 h[c] ( b3736 and b3737 and b3738 ) and ( b3731 and b3732 and b3733 and b3734 and b3735 ) and b3739 33.712 45.417 11.705 CYTBO3 2.500000 h[c] + 0.500000 o2[c] + q8h2[c] -> h2o[c] + 2.500000 h[e] + q8[c] ( b0429 and b0430 and b0431 and b0432 ) 25.128 34.95 9.822 EX_co2 co2[e] <=> NA 13.649 20.217 6.568 NADH6 4.500000 h[c] + nadh[c] + q8[c] -> 3.500000 h[e] + nad[c] + q8h2[c] ( b2276 and b2277 and b2278 and b2279 and b2280 and b2281 and b2282 and b2283 and b2284 and b2285 and b2286 and b2287 and b2288 ) 22.014 27.619 5.605 FUM fum[c] + h2o[c] <=> mal-L[c] ( b1612 or b4122 or b1611 ) 3.283 7.833 4.55 ENO 2pg[c] <=> h2o[c] + pep[c] b2779 8.198 7.273 -0.925 GLUDy glu-L[c] + h2o[c] + nadp[c] <=> akg[c] + h[c] + nadph[c] + nh4[c] b1761 -4.487 -6.195 -1.708 EX_nh4 nh4[e] <=> NA -5.76 -7.953 -2.193 EX_h h[e] <=> NA 4.928 1.812 -3.116 EX_o2 o2[e] <=> NA -12.568 -20 -7.432
Oxygen limitation and increasing catechol uptake
It is important to note that the uptake of catechol in our engineered strain of E. coli is predicted to be under oxygen limitation. For example, the OPT case of catechol degradation requires oxygen import at 20 mmol/gDW/h, which is the imposed maximum rate of oxygen transport. This value of oxygen transport limitation has been derived previously, and is an approximation of the diffusion rate based on the maximum concentration gradient of oxygen that can be achieved between the extracellular solution and cytosol. In vitro, sparging the experimental solution with oxygen gas may be required to ensure maximum oxygen available for transport to E. coli. Furthermore, it may be possible to engineer the E. coli strain to increase catechol degradation through the incorporation of gene deletions. Due to the oxygen limitation observed in the OPT case, a genome-wide scan of single gene deletions optimizing for the minimization of metabolic adjustment (MOMA) did not turn up any that were predicted to increase catechol uptake (data not shown). However, algorithms to identify multiple gene deletions have been developed that can be applied to this problem. For example, the OptKnock (Burgard et al, 2003) procedure introduces a bilevel optimization approach where a cellular objective (e.g. biomass production) and a bioengineering objective (e.g. catechol degradation) can be optimized simultaneously. This method aims to identify gene deletions that will change the structure of the metabolic network so that the bioengineering objective becomes coupled to biomass production for the growing organism. As an extension of this work, OptStrain (Burgard et al, 2004) considers the addition of reaction pathways to the metabolic system that would increase the bioengineering objective. These procedures may be applied in future work to enhance the catechol degradation capability of the engineered E. coli strain.
Molecular Simulations
In order to optimize the catechol degradation pathway such that there are proportional amounts of each of the multimeric enzyme complexes, monomer expression levels need to be adjusted appropriately. This will prevent an over-abundance or deficit of a particular enzyme. To determine the appropriate level of monomer expression for each enzyme, the multimerization equilibrium constant needs be estimated.
The equilibrium constant can be estimated using the formula:
where the standard Gibbs free energy change of the reaction ![]() .
.
If we assume entropy change is negligible, the formula then becomes:
The change in enthalpy for a reaction can be calculated using molecular simulations.
Results
Catechol 1,2-Dioxygenase (Dimer)
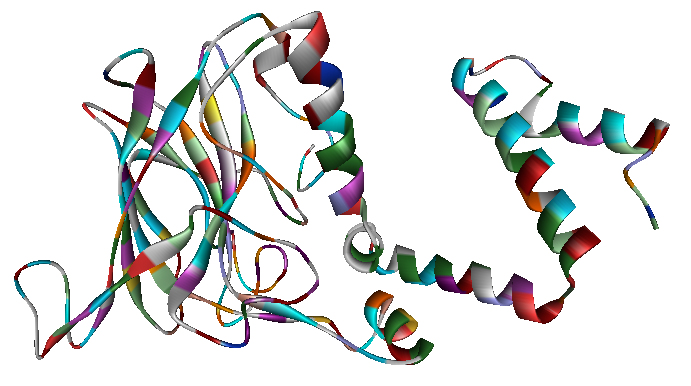
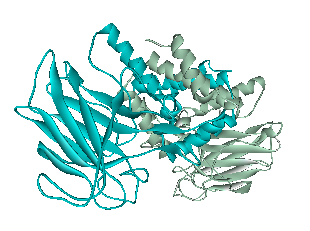
<p> The x-ray crystallography file for catechol 1,2-dioxygenase (2azq) only contains the monomer unit (Fig. 5). The dimer configuration was obtained using ZDOCK in Accelrys Discovery Studio (Fig. 6). The enthalpy change between the monomer and the dimer configuration was calculated using an augmented MM3 force field. The calculated enthalpy for a monomer unit was -39,326 kJ/mol. For a dimerized unit the enthalpy was -110,569 kJ/mol. Hence, the enthalpy change for the entire reaction is -31,917 kJ/mol. This yields K = 390,780 mol^-1.
Fig. 5. Catechol 1,2-dioxygenase monomer unit.
Fig. 6. Catechol 1,2-dioxygenase dimer as calculated by ZDOCK.
Future Directions
For the design of the linked enzymes, determining the equilibrium constants will be important to determine the proportion of properly assembled structures to those that have multiple linkers tangled with each other. The equilibrium constant will also be needed to determine the proportion of linked enzymes to ones that are not linked. We will continue to characterize the enthalpies associated with the remaining enzymes using the MM3 force field, along with other force fields such as CHARMM for comparison. For enzymes that do not have crystallography files associated with them, we will attempt to approximate their structures using homology modeling and other protein structure prediction methods.
 "
"

