Team:Slovenia/PROJECT/proof/popfret/fret
From 2010.igem.org
| Line 88: | Line 88: | ||
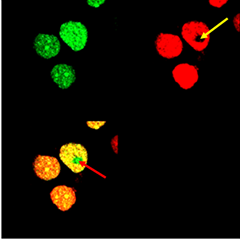
'''Figure 1: Photobleaching increases donor fluorescence and confirms FRET.''' <html> HEK293 cells expressing Gli1_link_nCFP (<a href="http://partsregistry.org/wiki/index.php?title=Part:BBa_K323021">BBa_K323021</a>), cCFP_link_HIVC (<a href="http://partsregistry.org/wiki/index.php?title=Part:BBa_K323029">BBa_K323029</a>), PBSII_link_nYFP (<a href="http://partsregistry.org/wiki/index.php?title=Part:BBa_K323005">BBa_323005</a>) and cYFP_link_Zif268 (<a href="http://partsregistry.org/wiki/index.php?title=Part:BBa_K323080">BBa_323080</a>) and carrying plasmid encoding program nucleic acid (<a href="http://partsregistry.org/wiki/index.php?title=Part:BBa_K323039">BBa_323039</a>)</html>. [Top left] Image of donor, reconstituted CFP, before photobleaching. [Top right] Image of acceptor, reconstituted YFP after photobleaching. Bleached area is marked with arrow. Photobleaching was performed on selected area and was done twice with 100 % laser pulse. [Bottom left] Overlay of donor and acceptor after photobleaching. Arrow indicates position of a bleaching point in an overlay mode showing the presence of increased donor signal and absence of acceptor signal due to photobleaching | '''Figure 1: Photobleaching increases donor fluorescence and confirms FRET.''' <html> HEK293 cells expressing Gli1_link_nCFP (<a href="http://partsregistry.org/wiki/index.php?title=Part:BBa_K323021">BBa_K323021</a>), cCFP_link_HIVC (<a href="http://partsregistry.org/wiki/index.php?title=Part:BBa_K323029">BBa_K323029</a>), PBSII_link_nYFP (<a href="http://partsregistry.org/wiki/index.php?title=Part:BBa_K323005">BBa_323005</a>) and cYFP_link_Zif268 (<a href="http://partsregistry.org/wiki/index.php?title=Part:BBa_K323080">BBa_323080</a>) and carrying plasmid encoding program nucleic acid (<a href="http://partsregistry.org/wiki/index.php?title=Part:BBa_K323039">BBa_323039</a>)</html>. [Top left] Image of donor, reconstituted CFP, before photobleaching. [Top right] Image of acceptor, reconstituted YFP after photobleaching. Bleached area is marked with arrow. Photobleaching was performed on selected area and was done twice with 100 % laser pulse. [Bottom left] Overlay of donor and acceptor after photobleaching. Arrow indicates position of a bleaching point in an overlay mode showing the presence of increased donor signal and absence of acceptor signal due to photobleaching | ||
| - | [[Image:Slo_bleech_ena_final_arrows.png|thumb|centre| | + | [[Image:Slo_bleech_ena_final_arrows.png|thumb|centre|300px|]] |
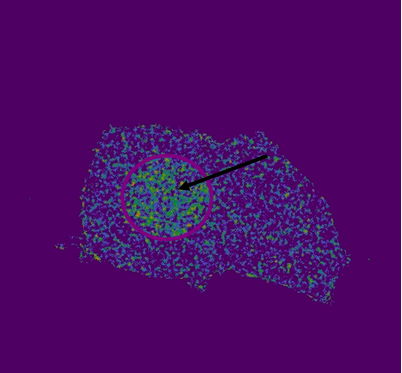
'''Figure 2: FRET efficiency after acceptor photobleaching calculated with LAS AF (Leica) software program using FRET AB method. '''An arrow and circle indicate photobleached area. FRET efficiency is presented as pseudocolor. Higher FRET efficiency is indicated with more intensive green and yellow colour. | '''Figure 2: FRET efficiency after acceptor photobleaching calculated with LAS AF (Leica) software program using FRET AB method. '''An arrow and circle indicate photobleached area. FRET efficiency is presented as pseudocolor. Higher FRET efficiency is indicated with more intensive green and yellow colour. | ||
| Line 96: | Line 96: | ||
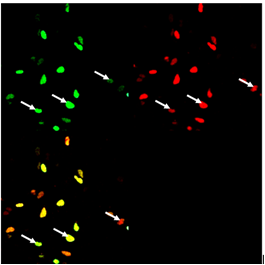
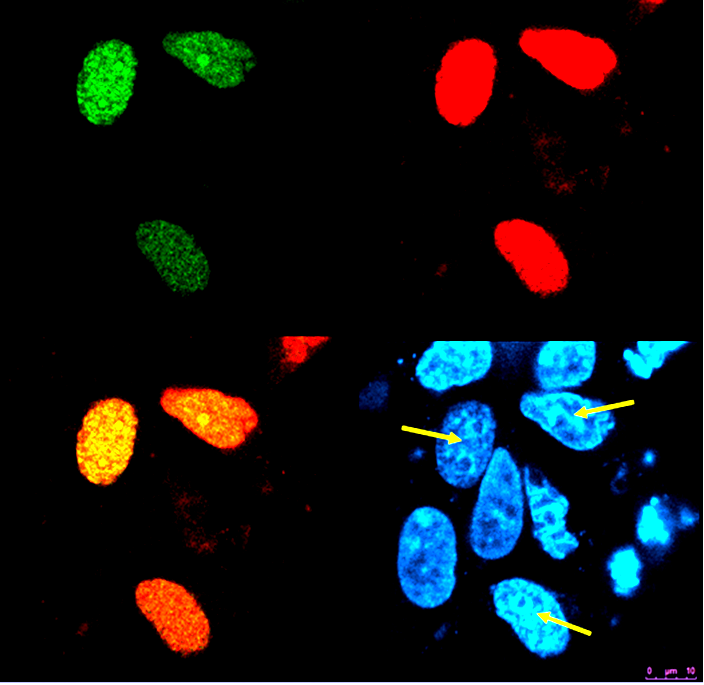
'''Figure 3: Variability of split GFP reconstitution signal.'''<html> HEK293 cells were transfected with plasmids encoding Gli1_link_nCFP (<a href="http://partsregistry.org/wiki/index.php?title=Part:BBa_K323021">BBa_K323021</a>), cCFP_link_HIVC (<a href="http://partsregistry.org/wiki/index.php?title=Part:BBa_K323029">BBa_K323029</a>),PBSII_link_nYFP (<a href="http://partsregistry.org/wiki/index.php?title=Part:BBa_K323005">BBa_323005</a>) and cYFP_link_Zif268 (<a href="http://partsregistry.org/wiki/index.php?title=Part:BBa_K323080">BBa_323080</a>) along with program nucleic acid (<ahref="http://partsregistry.org/wiki/index.php?title=Part:BBa_K323039">BBa_323039</a></html>. [Top left] Image of cells ecited with 458-nm Ar laser, emission from 470 to 510. [Top right] Image of cells excited at 514 nm, emission from 525 to 580. [Bottom left] Overlay of both channels.Arrows indicate cells expressing different split GFPs: split mCerulean and split mCitrine. Overlay image of cells varying from light green (donor is reconstituted more efficiently), yellow-orange (both split GFPs have similar reassembly efficiency), reddish (acceptor is reconstituted more efficiently). This experiment shows the presence of three groups of transfected cells in cell populations: cells expressing only one of both split proteins (meaning reassembled mCeruelan or mCitrine) and cells expressing all chimeric proteins leading to reconstiturion of both split fluorescent proteins at once. However all cells that exhibit fluorescence contain DNA program sequence. | '''Figure 3: Variability of split GFP reconstitution signal.'''<html> HEK293 cells were transfected with plasmids encoding Gli1_link_nCFP (<a href="http://partsregistry.org/wiki/index.php?title=Part:BBa_K323021">BBa_K323021</a>), cCFP_link_HIVC (<a href="http://partsregistry.org/wiki/index.php?title=Part:BBa_K323029">BBa_K323029</a>),PBSII_link_nYFP (<a href="http://partsregistry.org/wiki/index.php?title=Part:BBa_K323005">BBa_323005</a>) and cYFP_link_Zif268 (<a href="http://partsregistry.org/wiki/index.php?title=Part:BBa_K323080">BBa_323080</a>) along with program nucleic acid (<ahref="http://partsregistry.org/wiki/index.php?title=Part:BBa_K323039">BBa_323039</a></html>. [Top left] Image of cells ecited with 458-nm Ar laser, emission from 470 to 510. [Top right] Image of cells excited at 514 nm, emission from 525 to 580. [Bottom left] Overlay of both channels.Arrows indicate cells expressing different split GFPs: split mCerulean and split mCitrine. Overlay image of cells varying from light green (donor is reconstituted more efficiently), yellow-orange (both split GFPs have similar reassembly efficiency), reddish (acceptor is reconstituted more efficiently). This experiment shows the presence of three groups of transfected cells in cell populations: cells expressing only one of both split proteins (meaning reassembled mCeruelan or mCitrine) and cells expressing all chimeric proteins leading to reconstiturion of both split fluorescent proteins at once. However all cells that exhibit fluorescence contain DNA program sequence. | ||
| - | [[Image:Slo_kolokalizacija_final_arrows.png|thumb|centre| | + | [[Image:Slo_kolokalizacija_final_arrows.png|thumb|centre|250px]] |
'''Figure 4: ''In vivo'' reconstitution of two pairs of split fluorescence proteins (split CFP and split YFP) in nuclei determined with FRET.'''<html> HEK293 cells were cotransfected with plasmids encoding Gli1_link_nCFP (<a href="http://partsregistry.org/wiki/index.php?title=Part:BBa_K323021">BBa_K323021</a>), cCFP_link_HIVC (<a href="http://partsregistry.org/wiki/index.php?title=Part:BBa_K323029">BBa_K323029</a>),;PBSII_link_nYFP (<a href="http://partsregistry.org/wiki/index.php?title=Part:BBa_K323005">BBa_323005</a>) and cYFP_link_Zif268 (<a href="http://partsregistry.org/wiki/index.php?title=Part:BBa_K323080">BBa_323080</a>) along with program nucleic acid (<a href="http://partsregistry.org/wiki/index.php?title=Part:BBa_K323039">BBa_323039</a>)). [A. Top left] Image of the reconstituted CFP from split CFPs (Gli1_link_nCFP (<a href="http://partsregistry.org/wiki/index.php?title=Part:BBa_K323021">BBa_K323021</a>), cCFP_link_HIVC (<a href="http://partsregistry.org/wiki/index.php?title=Part:BBa_K323029">BBa_K323029</a>). Excitation at 458-nm Ar laser, emission from 470 to 510. [A. Top right] Image of reconstituted YFP from split YFPs (PBSII_link_nYFP (<a href="http://partsregistry.org/wiki/index.php?title=Part:BBa_K323005">BBa_323005</a>) and cYFP_link_Zif268 (<a href="http://partsregistry.org/wiki/index.php?title=Part:BBa_K323080">BBa_323080</a>)</html>. Excitation at 514 nm, emission from 525 to 580nm. [A. Bottom left] Overlay of CFP and YFP images from above. [A. Bottom right] The same cells stained with Hoechst 34580 dye. Arrows indicate FRET positive cells proving co-localisation of all four split GFP fusions within cell's nucleus. | '''Figure 4: ''In vivo'' reconstitution of two pairs of split fluorescence proteins (split CFP and split YFP) in nuclei determined with FRET.'''<html> HEK293 cells were cotransfected with plasmids encoding Gli1_link_nCFP (<a href="http://partsregistry.org/wiki/index.php?title=Part:BBa_K323021">BBa_K323021</a>), cCFP_link_HIVC (<a href="http://partsregistry.org/wiki/index.php?title=Part:BBa_K323029">BBa_K323029</a>),;PBSII_link_nYFP (<a href="http://partsregistry.org/wiki/index.php?title=Part:BBa_K323005">BBa_323005</a>) and cYFP_link_Zif268 (<a href="http://partsregistry.org/wiki/index.php?title=Part:BBa_K323080">BBa_323080</a>) along with program nucleic acid (<a href="http://partsregistry.org/wiki/index.php?title=Part:BBa_K323039">BBa_323039</a>)). [A. Top left] Image of the reconstituted CFP from split CFPs (Gli1_link_nCFP (<a href="http://partsregistry.org/wiki/index.php?title=Part:BBa_K323021">BBa_K323021</a>), cCFP_link_HIVC (<a href="http://partsregistry.org/wiki/index.php?title=Part:BBa_K323029">BBa_K323029</a>). Excitation at 458-nm Ar laser, emission from 470 to 510. [A. Top right] Image of reconstituted YFP from split YFPs (PBSII_link_nYFP (<a href="http://partsregistry.org/wiki/index.php?title=Part:BBa_K323005">BBa_323005</a>) and cYFP_link_Zif268 (<a href="http://partsregistry.org/wiki/index.php?title=Part:BBa_K323080">BBa_323080</a>)</html>. Excitation at 514 nm, emission from 525 to 580nm. [A. Bottom left] Overlay of CFP and YFP images from above. [A. Bottom right] The same cells stained with Hoechst 34580 dye. Arrows indicate FRET positive cells proving co-localisation of all four split GFP fusions within cell's nucleus. | ||
| Line 102: | Line 102: | ||
Only cells expressing all four chimeric proteins and DNA program sequence exhbit FRET. The functional chimeric proteins are localised in the nuclei. | Only cells expressing all four chimeric proteins and DNA program sequence exhbit FRET. The functional chimeric proteins are localised in the nuclei. | ||
| - | [[Image:Slo_FRET_graf.jpg|thumb|centre| | + | [[Image:Slo_FRET_graf.jpg|thumb|centre|250px|]] |
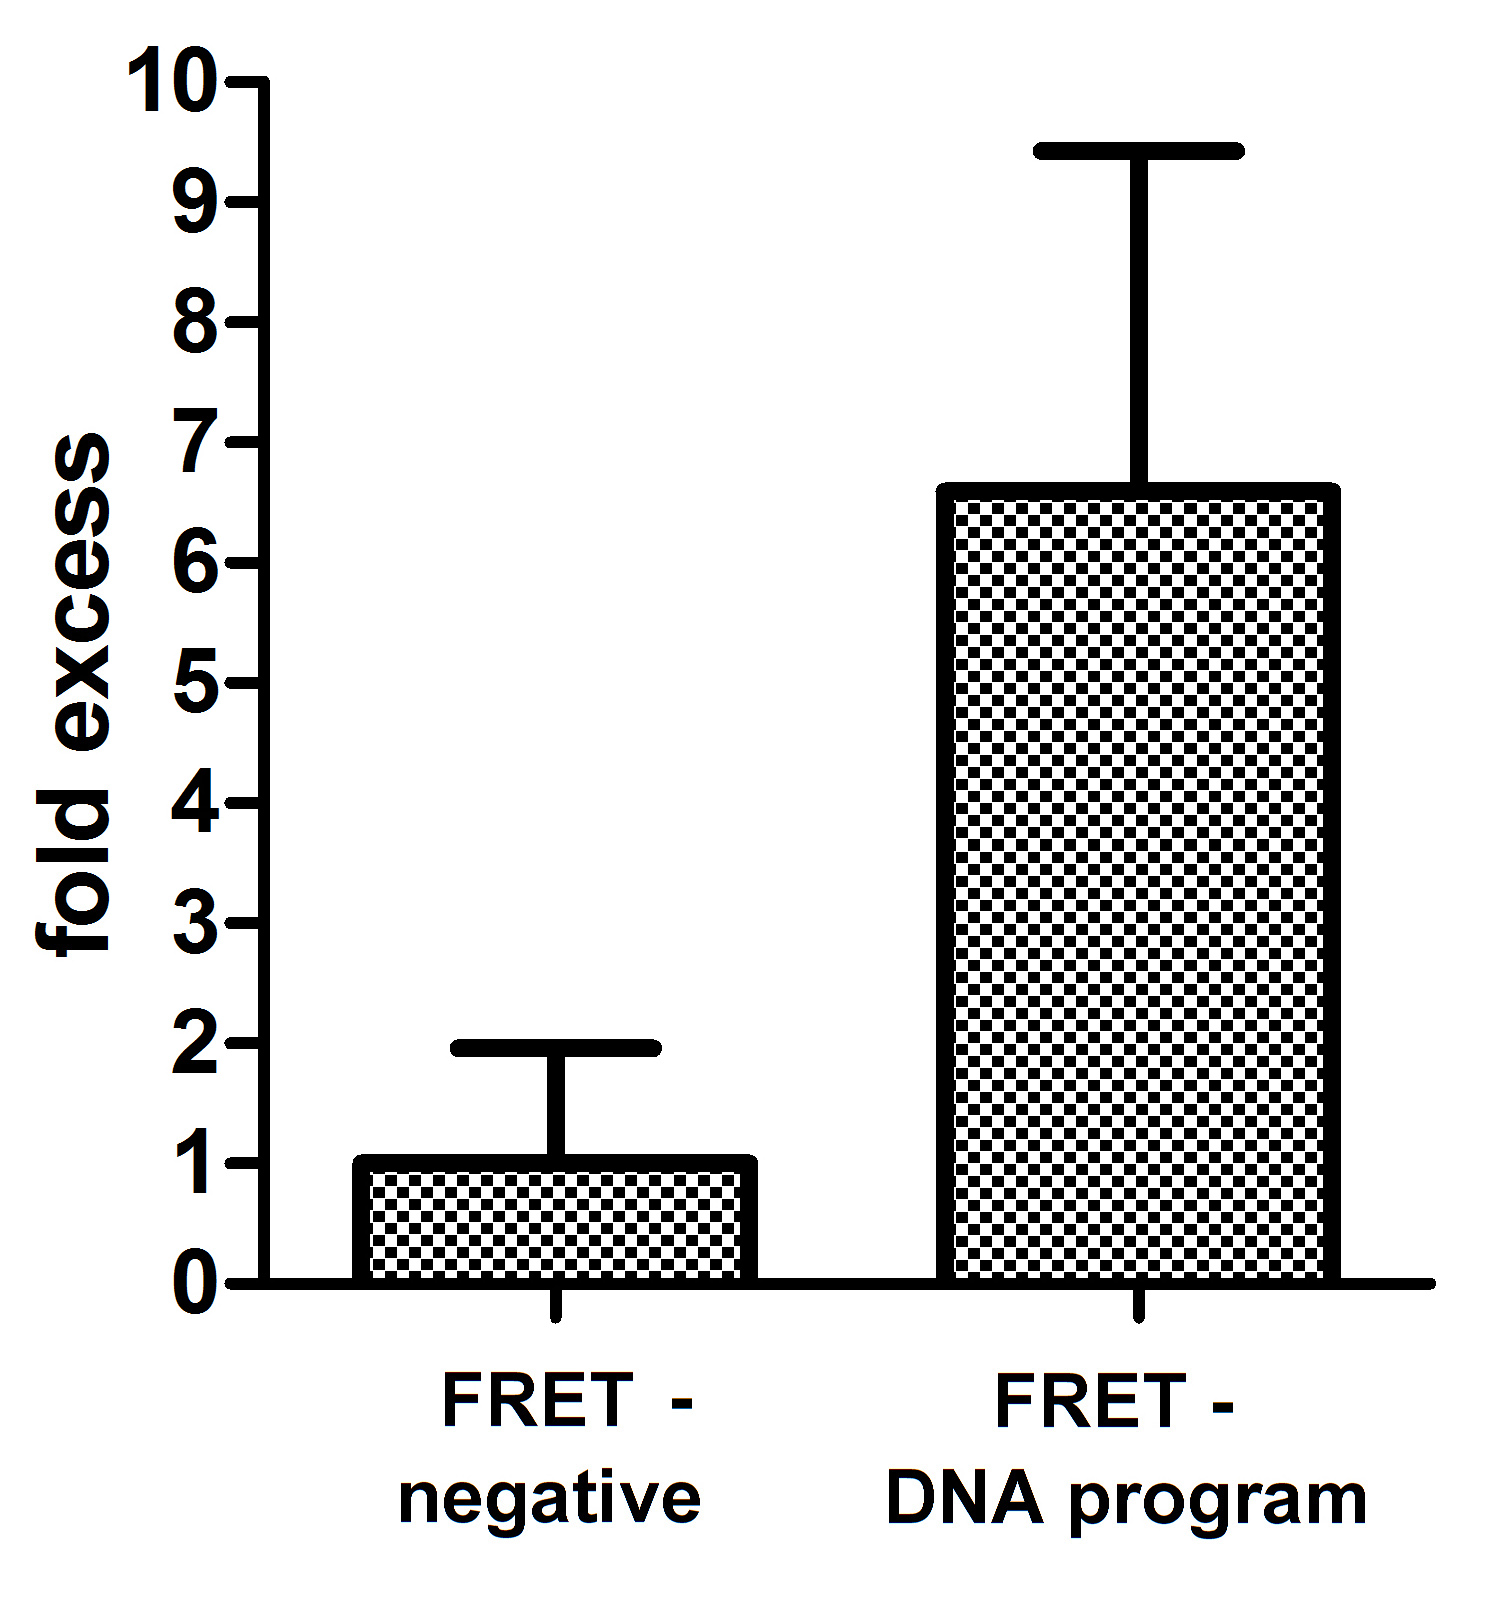
'''Figure 5: Quantification of the FRET effect upon addition of DNA program. '''Acceptor photobleaching method was used to determine the FRET efficiency. FRET efficiencies were calculated using FRET AB method within the LAS AF software (Leica). The method calculates an increase in donor (mCerulean) signal intensity as a consequence of bleached acceptor (mCitrine). Selected bleaching point in the acceptor channel was fully photobleached with 514nm laser light. Absolute numbers for FRET efficiencies using split GFPs to reconstitute FRET were normalised to negative control, being cytosolic mCerulean and mCitrine, to give us fold excess in FRET efficiency between the samples. Student's t-test with one tail and unequal variance was used to prove FRET statistically. We determined that there is only 0,45% probability that the datasets for negative control and FRET on a DNA program are the same. FRET efficiency was calculated for cells which were positive for both reconstituted split GFPs: mCerulean and mCitrine. | '''Figure 5: Quantification of the FRET effect upon addition of DNA program. '''Acceptor photobleaching method was used to determine the FRET efficiency. FRET efficiencies were calculated using FRET AB method within the LAS AF software (Leica). The method calculates an increase in donor (mCerulean) signal intensity as a consequence of bleached acceptor (mCitrine). Selected bleaching point in the acceptor channel was fully photobleached with 514nm laser light. Absolute numbers for FRET efficiencies using split GFPs to reconstitute FRET were normalised to negative control, being cytosolic mCerulean and mCitrine, to give us fold excess in FRET efficiency between the samples. Student's t-test with one tail and unequal variance was used to prove FRET statistically. We determined that there is only 0,45% probability that the datasets for negative control and FRET on a DNA program are the same. FRET efficiency was calculated for cells which were positive for both reconstituted split GFPs: mCerulean and mCitrine. | ||
Revision as of 00:42, 28 October 2010
Contents |
Introduction
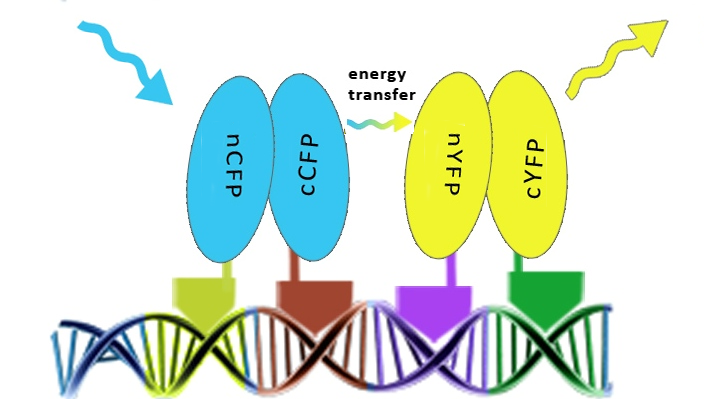
To prove that DNA program sequence could serve as a scaffold for more than two chimeric proteins, four split GFPs linked to zinc fingers were used. We predicted that DNA program sequence will promote a reconstitution of both pairs of split GFPs and FRET among reconstituted split GFPs. To achive that, cells have to express all four chimeric proteins and contain a DNA program sequence as well, all localised in the same region. Proving the principle in this way was achieved by FRET in mammalian cells. Selection of cells for FRET measurements is critical and is demonstrated below as well as proof for nuclear colocalisation of reconstituted split GFPs.
Results
We observed fluorescence intensity of donor, reconstituted CFP, and acceptor, reconstituted YFP, in HEK293 cells. In order to prove FRET using selected FRET pair, CFP and YFP, the acceptor photobleaching method was used. When acceptor, YFP, is bleached, the fluorescence intensity of donor increases and this is an indication of FRET. The higher an increase in fluorescence intensity of donor after photobleaching of acceptor, the higher the FRET efficiency. We observed fluorescence emission of acceptor pair indicating the FRET effect in transfected HEK293 cells. However for the reliable verification of the FRET effect we performed photobleaching, as described below, which should in case of FRET effect cause increase of the donor fluorescence.
Figure 1: Photobleaching increases donor fluorescence and confirms FRET. HEK293 cells expressing Gli1_link_nCFP (BBa_K323021), cCFP_link_HIVC (BBa_K323029), PBSII_link_nYFP (BBa_323005) and cYFP_link_Zif268 (BBa_323080) and carrying plasmid encoding program nucleic acid (BBa_323039). [Top left] Image of donor, reconstituted CFP, before photobleaching. [Top right] Image of acceptor, reconstituted YFP after photobleaching. Bleached area is marked with arrow. Photobleaching was performed on selected area and was done twice with 100 % laser pulse. [Bottom left] Overlay of donor and acceptor after photobleaching. Arrow indicates position of a bleaching point in an overlay mode showing the presence of increased donor signal and absence of acceptor signal due to photobleaching
Figure 2: FRET efficiency after acceptor photobleaching calculated with LAS AF (Leica) software program using FRET AB method. An arrow and circle indicate photobleached area. FRET efficiency is presented as pseudocolor. Higher FRET efficiency is indicated with more intensive green and yellow colour.
Figure 3: Variability of split GFP reconstitution signal. HEK293 cells were transfected with plasmids encoding Gli1_link_nCFP (BBa_K323021), cCFP_link_HIVC (BBa_K323029),PBSII_link_nYFP (BBa_323005) and cYFP_link_Zif268 (BBa_323080) along with program nucleic acid (
Figure 4: In vivo reconstitution of two pairs of split fluorescence proteins (split CFP and split YFP) in nuclei determined with FRET. HEK293 cells were cotransfected with plasmids encoding Gli1_link_nCFP (BBa_K323021), cCFP_link_HIVC (BBa_K323029),;PBSII_link_nYFP (BBa_323005) and cYFP_link_Zif268 (BBa_323080) along with program nucleic acid (BBa_323039)). [A. Top left] Image of the reconstituted CFP from split CFPs (Gli1_link_nCFP (BBa_K323021), cCFP_link_HIVC (BBa_K323029). Excitation at 458-nm Ar laser, emission from 470 to 510. [A. Top right] Image of reconstituted YFP from split YFPs (PBSII_link_nYFP (BBa_323005) and cYFP_link_Zif268 (BBa_323080). Excitation at 514 nm, emission from 525 to 580nm. [A. Bottom left] Overlay of CFP and YFP images from above. [A. Bottom right] The same cells stained with Hoechst 34580 dye. Arrows indicate FRET positive cells proving co-localisation of all four split GFP fusions within cell's nucleus.
Only cells expressing all four chimeric proteins and DNA program sequence exhbit FRET. The functional chimeric proteins are localised in the nuclei.
Figure 5: Quantification of the FRET effect upon addition of DNA program. Acceptor photobleaching method was used to determine the FRET efficiency. FRET efficiencies were calculated using FRET AB method within the LAS AF software (Leica). The method calculates an increase in donor (mCerulean) signal intensity as a consequence of bleached acceptor (mCitrine). Selected bleaching point in the acceptor channel was fully photobleached with 514nm laser light. Absolute numbers for FRET efficiencies using split GFPs to reconstitute FRET were normalised to negative control, being cytosolic mCerulean and mCitrine, to give us fold excess in FRET efficiency between the samples. Student's t-test with one tail and unequal variance was used to prove FRET statistically. We determined that there is only 0,45% probability that the datasets for negative control and FRET on a DNA program are the same. FRET efficiency was calculated for cells which were positive for both reconstituted split GFPs: mCerulean and mCitrine.
Discussion
Our results clearly demonstrate that DNA program sequence could be used as a scaffold for four chimeric proteins. This was proved with FRET among four functional proteins linked to zinc fingers. DNA program sequence facilitated reconstitution of mature GFPs and in addition also positioned both GFPs in a manner so that FRET was detected. FRET efficiency was detected for the negative control. This might be a consequence of fixing the cells and bringing highly expressed cytosolic GFPs close enough to detect FRET.
We can conclude from the evidence that we can assemble four chimeric proteins in a defined order using DNA scaffold. Reconstituted fluorescent proteins and FRET effect prove the concept of DNA-guided assembly of functional proteins that could be used for different applications.
 "
"
