Design usu.html
From 2010.igem.org
| Line 22: | Line 22: | ||
In Synechocystis sp. PCC 6803, the cells naturally take up DNA from the media and recombine it with the genome in regions of homology. If two regions of homology are closely spaced on the chromosome and the foreign DNA, the regions between the two homologous regions are exchanged (Figure 2). After recombination with the recombination plasmid in this project, the exchanged fragment of genomic DNA is lost from the cell due to the plasmid’s inability to replicate in PCC 6803. | In Synechocystis sp. PCC 6803, the cells naturally take up DNA from the media and recombine it with the genome in regions of homology. If two regions of homology are closely spaced on the chromosome and the foreign DNA, the regions between the two homologous regions are exchanged (Figure 2). After recombination with the recombination plasmid in this project, the exchanged fragment of genomic DNA is lost from the cell due to the plasmid’s inability to replicate in PCC 6803. | ||
| - | [[Image:USU_Integration_1.png| | + | [[Image:USU_Integration_1.png|428px]] |
[[Image:USU_Integration_2.png|435px]] | [[Image:USU_Integration_2.png|435px]] | ||
| Line 36: | Line 36: | ||
<li>Using integration, more dramatic changes can be made to cells than with traditional plasmid cloning. If the recombination regions flank a gene you wish to remove from the cells, the act of inserting the BioBrick (or merely the antibiotic selection marker) will cause the gene to be deleted. This can enable new genes to be inserted to replace those in the host species, for example exchanging a gene requiring that a cofactor be added to the media with a gene homolog that doesn’t need the cofactor could enable a bio-product to be produced much less expensively. | <li>Using integration, more dramatic changes can be made to cells than with traditional plasmid cloning. If the recombination regions flank a gene you wish to remove from the cells, the act of inserting the BioBrick (or merely the antibiotic selection marker) will cause the gene to be deleted. This can enable new genes to be inserted to replace those in the host species, for example exchanging a gene requiring that a cofactor be added to the media with a gene homolog that doesn’t need the cofactor could enable a bio-product to be produced much less expensively. | ||
<li>With proper homologous regions, genes could also be inserted into the middle of operons, allowing gene expression to occur in a predictable fashion, with little effort expended in choosing proper promoter conditions. | <li>With proper homologous regions, genes could also be inserted into the middle of operons, allowing gene expression to occur in a predictable fashion, with little effort expended in choosing proper promoter conditions. | ||
| - | <ul> | + | </ul> |
=Promoter and RBS Design= | =Promoter and RBS Design= | ||
Revision as of 21:39, 27 October 2010
Design
Contents |
Plasmid Design
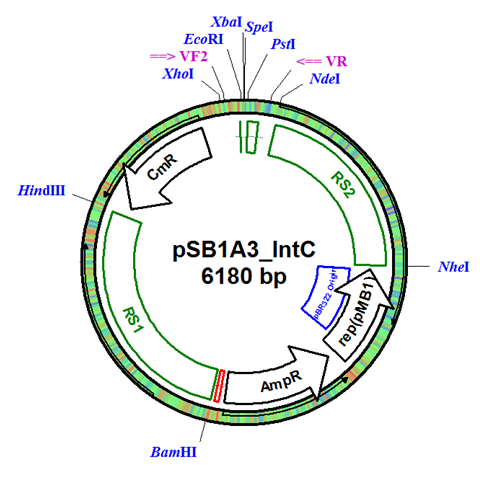
In this project, we designed our integration vector as a standardized and adaptable plasmid to allow for integration in a variety of species. The full integration vector (Figure 1) allows for the easy exchange of resistance genes and integration regions with only a restriction digest and ligation of the new regions. A variety of recombination regions can be added to the plasmid to allow for gene integration in any desired area of the genome, and multiple resistance genes allows for more complex experiments where multiple regions are integrated and selected for simultaneously.
The integration plasmid is based off of pSB1A3, which allows it to replicate in high copy number in E. coli during the construction of the BioBrick part. This provides large amounts of DNA for analysis and future transformations into cyanobacteria.
Figure 1. Integration Plasmid pSB1A3_IntC. Plasmid contains two exchangeable recombination regions RS1 and RS2, each flanked by restriction sites for easy modification. Plasmid also contains the Chloramphenicol resistance gene (CmR), which is also easily exchanged through restriction digest.
Overview of Integration
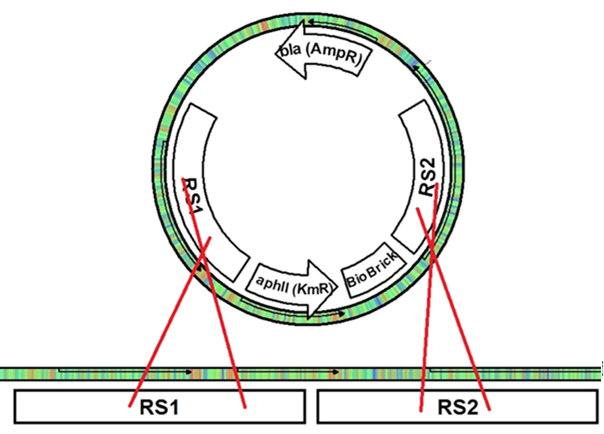
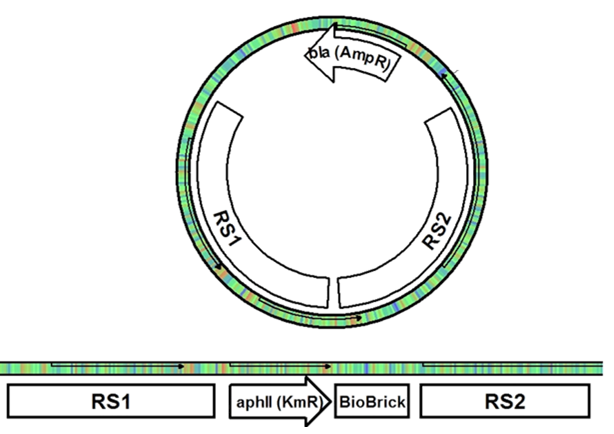
In Synechocystis sp. PCC 6803, the cells naturally take up DNA from the media and recombine it with the genome in regions of homology. If two regions of homology are closely spaced on the chromosome and the foreign DNA, the regions between the two homologous regions are exchanged (Figure 2). After recombination with the recombination plasmid in this project, the exchanged fragment of genomic DNA is lost from the cell due to the plasmid’s inability to replicate in PCC 6803.
Figure 2. (A) Once the integration plasmid comes across the homologous part of the genome, crossing over occurs between the plasmid and the chromosome. (B) Since there are two recombination regions, the crossing over resolves with the regions between the homologous regions switching locations, leaving the BioBrick and resistance gene in the genome. The plasmid is then lost from the cells as it is unable to replicate in PCC 6803.
Advantages and Applications of Integration
The use of an integration plasmid for synthetic biological engineering possesses many advantages, and a few disadvantages, compared to using plasmid vectors.
- With integration, the copy number of the inserted BioBrick is more precisely known than with plasmids, allowing for more predicable levels of protein expression. Inserted into the main genome, only one or two copies of the gene will exist in the cell at any given time. If higher copy number is desired, and the species possesses other chromosomes of different copy number, the integration can be targeted to these other chromosomes. The copy number of chromosomes is generally more stable, varying only by one or two copies from cell to cell, whereas a plasmid vary between cells by as much as several hundred copies.
- Integration also affords more stable replication and retention of the BioBrick, as entire chromosomes are rarely lost from a cell, but plasmids with low replication rates may be lost to some daughter cells during division. This is especially true for species such as Synechocystis, which do not retain plasmids very efficiently.
- Traditional cloning with plasmids is also limited in scale. Plasmid vectors start becoming unstable in cells at around 20,000 bp in length, and may be retained only in a small proportion of cells. By inserting the BioBricks into the chromosome from integration vector, a series of 20,000 bp inserts can be added to the cell, giving a potentially limitless capacity for modification.
- Using integration, more dramatic changes can be made to cells than with traditional plasmid cloning. If the recombination regions flank a gene you wish to remove from the cells, the act of inserting the BioBrick (or merely the antibiotic selection marker) will cause the gene to be deleted. This can enable new genes to be inserted to replace those in the host species, for example exchanging a gene requiring that a cofactor be added to the media with a gene homolog that doesn’t need the cofactor could enable a bio-product to be produced much less expensively.
- With proper homologous regions, genes could also be inserted into the middle of operons, allowing gene expression to occur in a predictable fashion, with little effort expended in choosing proper promoter conditions.
Promoter and RBS Design
Genome Analyzer Program
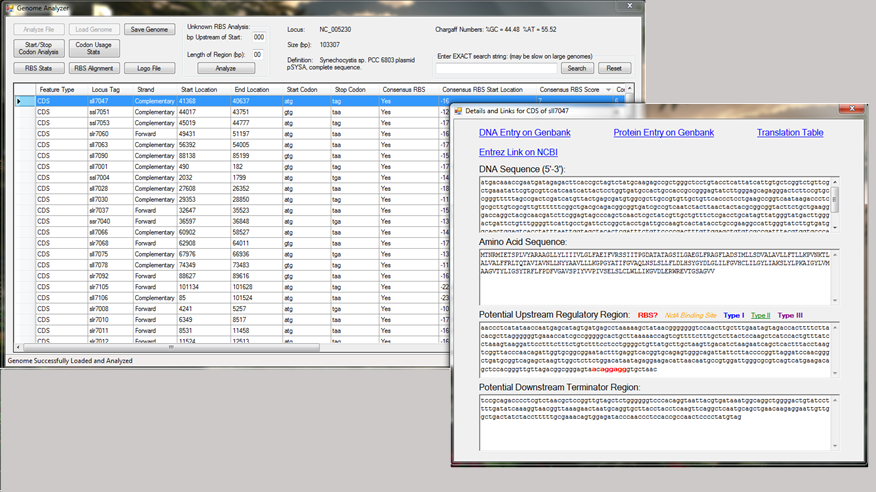
Team member Cody Tramp constructed a computer program to analyze a GenBank genome file and provide information about promoter and RBS design (see Figure 3 for a screenshot). The program (which is currently undergoing compatibility revisions before releasing it for general use) creates a searchable database of individual genes that can be filtered for similarity to promoter consensus sequences or can be used to determine common structural features of the genome. In this project, the program was used to identify the codon usage profile for Synechocystis and to determine the consensus ribosome binding site.
Figure 3. Screenshot of Cody’s Genome Analyzer program. The left window shows the database of all genes in the genome, and the right window is a pop-up window containing links to major databases with information on the gene. The pop-up window can also be programmed to highlight matches to consensus promoter sequences or ribosome binding sites.
Consensus Ribosome Binding Site
The ribosome bindings site used in device construction are vital to the final performance of the part. RBS sequences, however, are dependent on the sequence of the 3’ end of the 16S rRNA ribosomal subunit, which can vary from species to species. Using the Genome Analyzer program, we were able to determine the consensus RBS of Synechocystis sp. PCC 6803 by analyzing the sequence upstream of every gene in the genome. The sequence complimentary to the 3’ end of the 16S rRNA sequence for Syncechocystis (and thus the RBS as seen on the mRNA) is AAAGGAGGT. The Genome Analyzer program found each of these bases to be conserved in different percentages of genes, and that some sequences surrounding the RBS to be highly conserved as well (Figure 4). Thus the full consensus RBS for Synechocystis is TTTAAAGGAGGTTAAA, followed by the start codon.
Figure 4. Ribosome binding site consensus sequence as determined by Genome Analyzer program analyzing the upstream region of every gene in the genome. Note positions are number relative to the first base pair match with the 16S rRNA sequence, and not with the start codon. Colors on the lower sequence indicate level of conservation, with red indicating high conservation, yellow moderate, and green low.
Codon Usage Profile
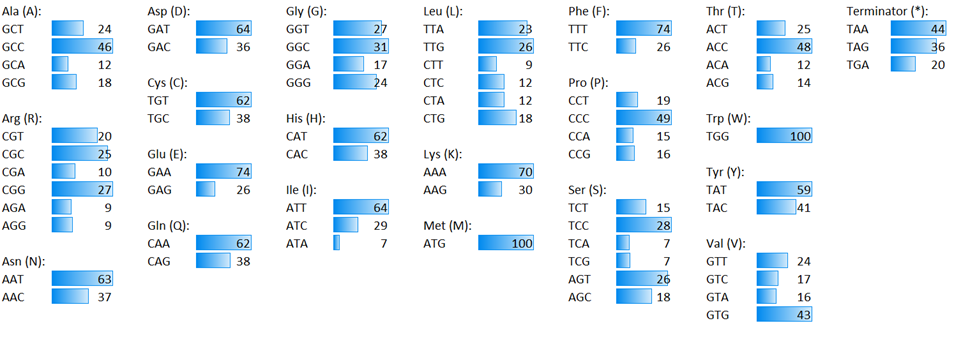
In addition to determining the consensus RBS for optimal gene expression, the codon usage of the gene’s themselves must be matched with the new host genome’s tRNA usage in order to be efficiently produced. The codons for each amino acid that are favored by tRNA’s can be roughly deduced from the frequencies with which each codon is used across all the genes in the genome. Figure 5 shows the summary of the codon usage profile for Synechocystis sp. PCC 6038 as generated by the Genome Analyzer program.
Figure 5. Codon usage profile for Synechocystis sp. PCC 6038 as generated by the Genome Analyzer program. Blue bars indicate relative usage levels within that amino acid, scaled relative to the most used codon for each amino acid. All values are in percent.
 "
"

