Team:TU Delft/Modeling/pcaif-model
From 2010.igem.org
(→pCaif Model: Induction through Starvation) |
(→pCaif Model: Induction through Starvation) |
||
| Line 80: | Line 80: | ||
'''10g/L glucose:''' | '''10g/L glucose:''' | ||
| - | [[Image:TUDelft_pCaif_10g.png| | + | [[Image:TUDelft_pCaif_10g.png|600px]] |
'''2g/L glucose:''' | '''2g/L glucose:''' | ||
| - | [[Image: | + | [[Image:TUDelft_pCaif_2g.png|400px]] |
'''1g/L glucose + 0.9 g/L lauric acid:''' | '''1g/L glucose + 0.9 g/L lauric acid:''' | ||
| - | [[Image: | + | [[Image:TUDelft_pCaif_1g.png|400px]] |
===Conclusions=== | ===Conclusions=== | ||
Revision as of 16:25, 27 October 2010
pCaif Model: Induction through Starvation
We would like to thank Aljoscha for helping us out with this model.
This model is an extension of the sensing sub-project
Aim
We implemented the pCaiF promotor to enable a metabolic switch from glucose to hydrocarbons. As the complete BioBrick for hydrocarbon degradation is not available yet, we mimic the switch using the end product of the hydrocarbon degradation, lauric acid. The fatty acid degradation is under the control of fadR, which is like pCaiF under the control of crp-cAMP. To check the function of pCaiF a series of experiments has been performed (link data) and a simple model is set-up to analyze the capabilities of the BioBrick.
Experimental Basis
Of special interest was a set of three experiments:
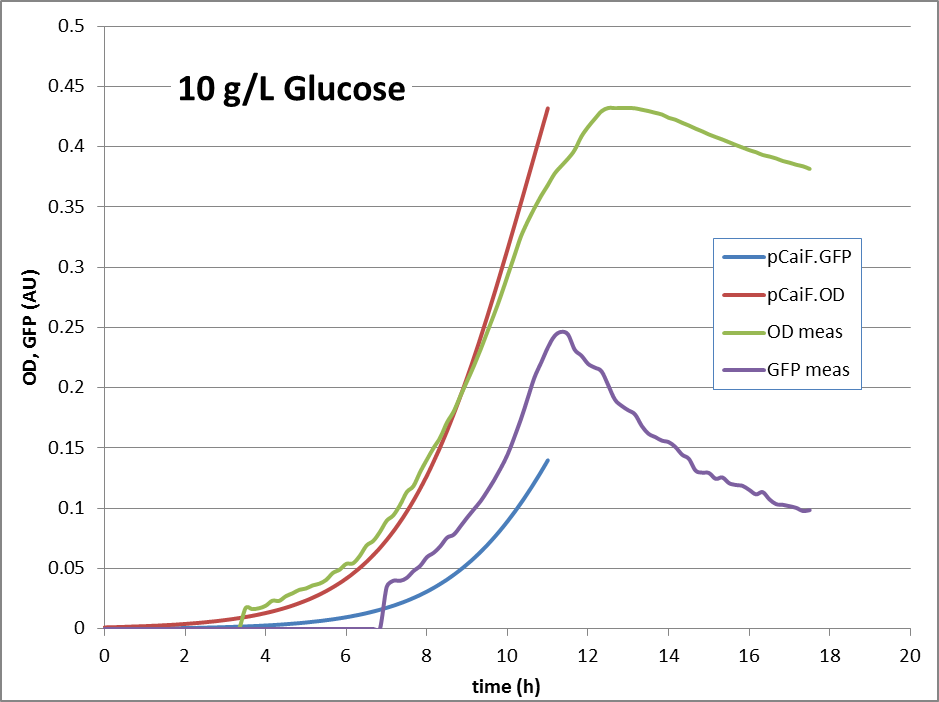
10g Glucose: Here, no glucose depletion is reached. The expression of genes under pCaiF control should be ‘off’.
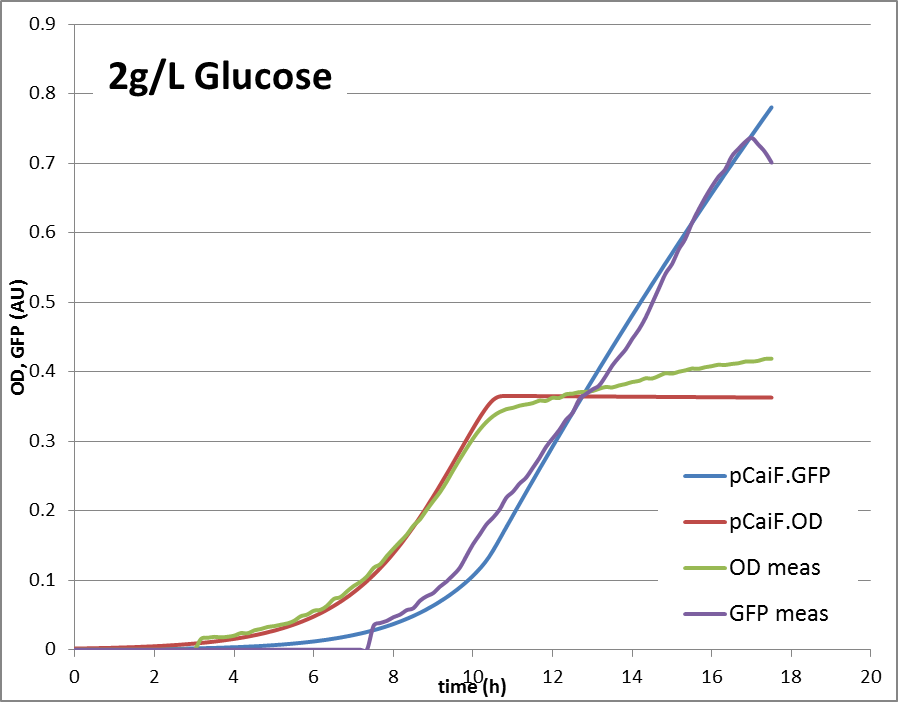
2g Glucose: Glucose depletion is reached, but there is no alternative substrate at high concentration. The cells are expected to accumulate high cAMP amounts and try to increase the uptake capacities by high expression of alternative carbon source pathways.
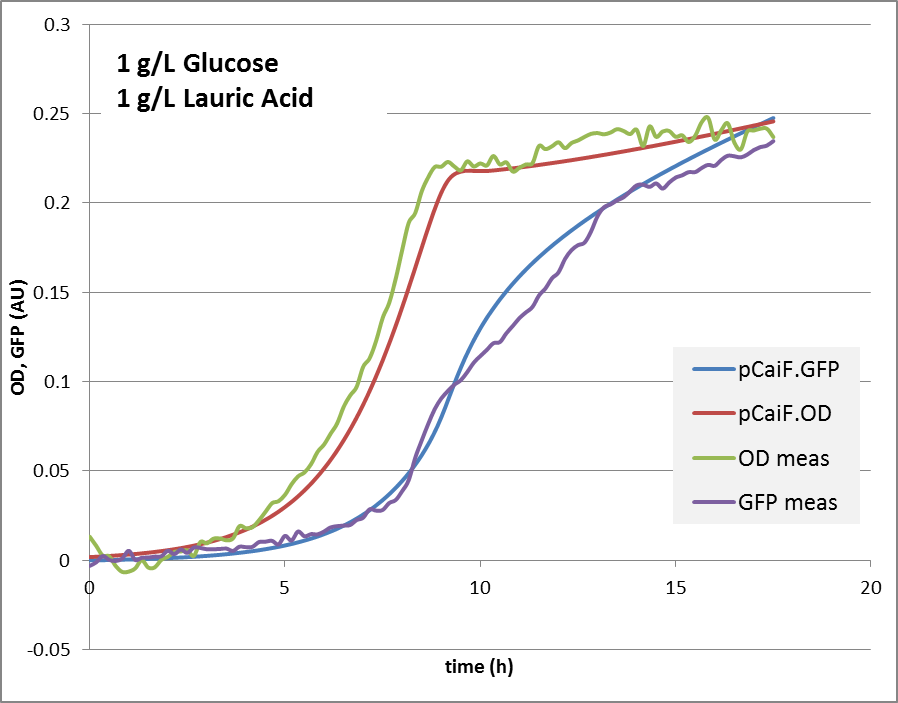
1g Glucose + 0.9g Lauric Acid: Glucose depletion is reached fast, and there is an alternative substrate available. Lauric acid is consumed via beta oxidation that is under the control of fadR. We expect a switch and autoregulation behavior. When glucose is depleted, the genes for lauric acid degradation are expressed. For a short period of time, the carbon influx is very limiting, cAMP levels are high. Then the influx of lauric acid delivers carbon and energy, cAMP drops again, the protein production is reduced until an equilibrium is reached.
Modeling Approach
From the discussion on the experiments, a set of hypothesis has been derived:
1. cAMP levels are coupled to the carbon influx: It is assumed that the concept of flux sensors as shown recently by Kotte et al., 2010 can be applied to ‘measure’ the flux for the two carbon degradation pathways. Kremling et. al. 2007 have shown that scrY that is also dependent on the transcription factor crp has a hyperbolic Hill relation (with n=6) to the EIIACrr ratio. Assuming that the that EIIACrr ratio is related to the cAMP levels, we used following relation between cAMP and the uptake flux qGlc:
Comparably, a less ‘steep’ function was defined for cAMP levels in dependence of the lauric acid uptake:
To combine the two levels, a multiplication is applied (if one flux operates at max rate, the cAMP should be zero, in case of two low fluxes the cAMP has to be high:
Note that cAMP is basically modeled on a normalized scale 0-1. Clearly that is a strong simplification, but as no detailed intracellular data is available we take this relative scale.
2. Growth Stoichiometry: Yield, maximal uptake rates: The stoichiometric coefficients were taken from Lin et al. 2001 and adapted slightly to enable reaching our biomass concentrations:
for lauric acid no value has been found so we made an assumption:
The maximal uptake rate on glucose was determined by Lin et al. 2001:
For lauric acid, the enzyme concentration is modeled – we had to assume some specific enzyme activity:
The growth rate depends on the uptake of both substrates:
As in some experiments nitrogen limitation is reached, growth is additionally dependent on the N availability:
Again, this mechanism is simplifying – in the experiments saturation is observed at OD=0.45 (corresponding to about 0.13 gCDW/L).
3. Enzyme expression: The expression of the enzyme depends on the intracellular cAMP levels with a hyberbolic relationship (n=1.5):
The parameters were chosen based on ‘good’ estimates derived Alon (2007).
There is dilution and degradation, the balance for the enzyme then reads:
Parameter fine tuning
With the experimental data in hand we were able to perform a parameter estimation based on the data of the three mentioned experiments.
Results
The reproduction of the experimental results is shown in fig. 1. Please note, that the same parameters are able to reproduce the different conditions.
10g/L glucose:
2g/L glucose:
1g/L glucose + 0.9 g/L lauric acid:
Conclusions
The model helped us in keeping track of the possible mechanisms that could be ‘behind’ the data. It clearly shows, that a simple approach – taking assumptions of relations between concentrations and fluxes together with a simple enzyme expression model can explain the observed behavior under three conditions. It also clearly shows another property – the expression of the pathway enzymes are ‘auto-controlled’. If the protein levels drop, the flux will drop, cAMP rises and the expression will rise. Also, if there is too much enzyme, the cAMP levels will drop significantly, enzyme expression will stop, until a limiting situation is reached again. That finding surprised us, showing that a very simple, and very small BioBrick can do the job of protein level regulation.
References
- Kotte, O, Zaugg, J., Heinemann, M., Bacterial adaptation through distributed sensing of metabolic fluxes, Molecular Systems Biology, 6:355, 2010 doi:10.1038/msb.2010.10
- Kremling, A., Bettenbrock, K., Gilles, E.D., Analysis of global control of Escherichia coli carbohydrate uptake, BMC Systems Biology, 1:42, 2007 doi:10.1186/1752-0509-1-42
- Lin, H. Y., Mathiszik, B., Xu, B., Enfors, S.-O., Neubauer, P., Determination of the Maximum Specific Uptake Capacities for Glucose and Oxygen in Glucose-Limited Fed-Batch Cultivations of Escherichia coli, Biotechnology and Bioengineering, 73, 347-357, 2001
- Alon, U. (ed.), An Introduction to Systems Biology: Design Principles of Biological Circuits, CRC Press, 2007
 "
"


