Team:TU Delft/Project/sensing/results
From 2010.igem.org
(→BBa_K398326 pCaiF IN NUMBER) |
(→BBa_K398326 pCaiF IN NUMBERS) |
||
| Line 35: | Line 35: | ||
Our findings in this experiment were really interesting, because as we expected the GFP production decreases when the catabolism of the secondary carbon source starts. You can check that in the plot because of the change in the slope for the GFP profile. | Our findings in this experiment were really interesting, because as we expected the GFP production decreases when the catabolism of the secondary carbon source starts. You can check that in the plot because of the change in the slope for the GFP profile. | ||
| - | =====[http://partsregistry.org/Part: | + | ===== Does [http://partsregistry.org/Part:BBa_K398326 pCaiF] really works under starvation???===== |
| + | We had some doubts about the activity of pCaiF under starvation periods because we saw all the time a leaky production of GFP that followed the biomass profile. We decided to compare the GFP production during exponential phase and stationary phase. | ||
| + | |||
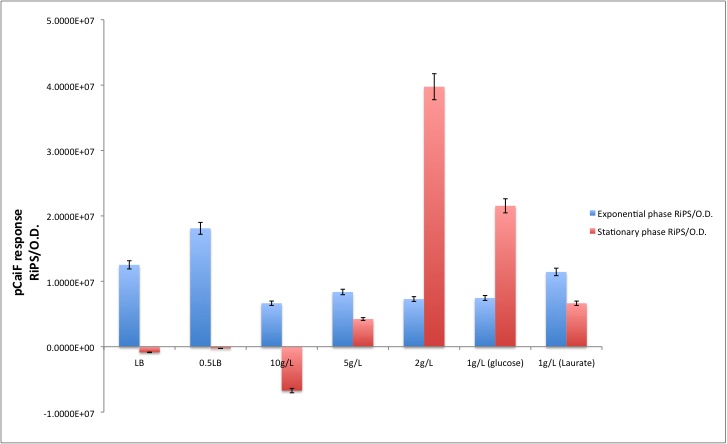
| + | [[Image:TU_Delft_pCaiF_final2.jpg|600px|thumb|center|Comparison of the GFP production rates during exponential and stationary phase.]] | ||
| + | According to our results, there is indeed a difference between both conditions. Which is specially clear when the glucose initial concentration is 2 g/L. For the Laurate growth phase in the diauxic experiment we saw a remaining activity from the glucose starvation period and during Laurate consumption we saw a reduction in the GFP production as we expected. | ||
| - | + | =====[http://partsregistry.org/Part:BBa_K398326 BBa_K398326 pCaiF] IN NUMBERS===== | |
| - | [ | + | |
| - | + | ||
<table class="tableizer-table"> | <table class="tableizer-table"> | ||
Revision as of 12:01, 27 October 2010

Sensing Results
pCaiF strength
[http://partsregistry.org/Part:BBa_K398326 BBa_K398326 pCaiF]
[http://partsregistry.org/Part:BBa_K398326 BBa_K398326 (pCaiF)] is by far the smallest part of our project; as we explained before we looked for a promoter that could enable the expression proteins under low glucose concentrations in order to mimic a diauxic shift for the alkane degradation system: once the glucose starts to be limiting factor the expression of alkane degradation genes under pCaiF control will enable (theoreticallly) to the cells shift from glucose metabolism to alkane degradation, everything done by a piece of just 51 bp.
The pCaiF regulation mechanism is really simple, [http://partsregistry.org/Part:BBa_K398326 BBa_K398326 (pCaiF)] contains a cAMP-crp complex binding domain, cAMP-crp is known as transcriptional regulator. When glucose concentrations in the surroundings are high, cAMP levels are low because there is a lot of energy source that can be metabolized by the cells; however during starvation periods cAMP levels increase and thus the concentration of the complex cAMP-crp activating at least 180 genes related to starvation response. Among those CaiF a protein used during Carnitine anaerobic metabolism.
LB medium
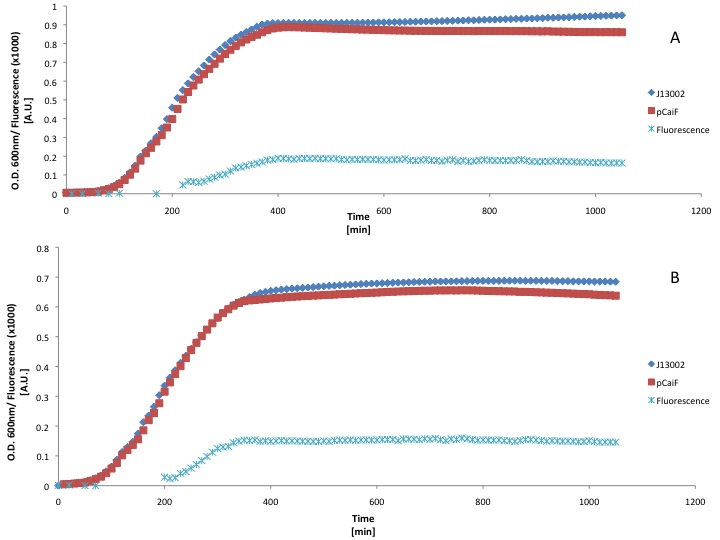
Due to time constraints we couldn't make a more elegant circuit or express our proteins using [http://partsregistry.org/Part:BBa_K398326 BBa_K398326 (pCaiF)], however we wanted to show that the part does what we expected: Protein production at low glucose concentrations. We attached a GFP generator in order to measure the output of our part. First we used a rich medium (LB) and we diluted it with M9 medium without glucose (50% v/v) in order to show the differences in protein expression when the carbon source concentration is lower in a rich medium.
Our findings suggest that there is a slight improvement on GFP production when the LB medium is diluted 50%. However the fluorescence produced is a really low signal and we didn't see an increase of GFP production during the stationary phase (starvation). This could be due to the fact that LB medium can keep the cAMP levels low for long periods of time.
M9 minimal medium
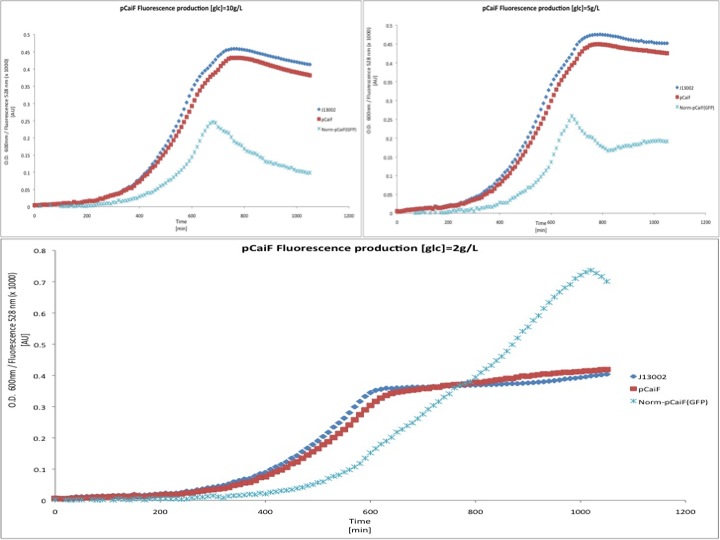
We also tested the response of pCaiF using minimal M9 medium at glucose concentrations of 10 g/L, 5 g/L and 2 g/L. From this experiment we expected to see how pCaiF responses when the starvation phase starts earlier during normal E. coli cultures.
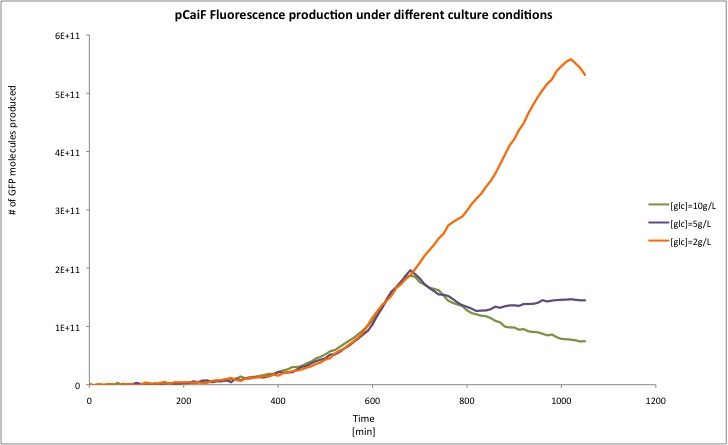
In this experiment we clearly saw a significant increase in GFP production when the glucose initial concentration was 2 g/L compared to our result for an initial glucose concentration of 10 g/L; whereas at 5 g/L we found a slight increase in GFP production at the end of our measurements. From these plots we can conclude that our part is sensitive to cAMP levels as we expected. Moreover, we found that our part is active under starvation periods (stationary phase at low glucose concentrations). We overlapped the plots in order to show the differences between the different conditions tested.
Diauxic shift
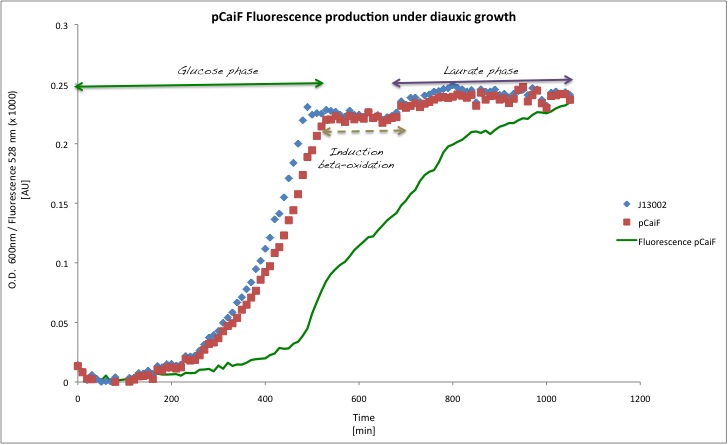
In order to see the effect of a second carbon source in the medium, we decided to low down even more the initial glucose amount to 1 g/L and we added Potassium Laurate at a final concentration of 5 mM. With this experiment we expected to see how the GFP profile behaves when cAMP levels drop because of the catabolism of a second carbon source.
Our findings in this experiment were really interesting, because as we expected the GFP production decreases when the catabolism of the secondary carbon source starts. You can check that in the plot because of the change in the slope for the GFP profile.
Does [http://partsregistry.org/Part:BBa_K398326 pCaiF] really works under starvation???
We had some doubts about the activity of pCaiF under starvation periods because we saw all the time a leaky production of GFP that followed the biomass profile. We decided to compare the GFP production during exponential phase and stationary phase.
According to our results, there is indeed a difference between both conditions. Which is specially clear when the glucose initial concentration is 2 g/L. For the Laurate growth phase in the diauxic experiment we saw a remaining activity from the glucose starvation period and during Laurate consumption we saw a reduction in the GFP production as we expected.
[http://partsregistry.org/Part:BBa_K398326 BBa_K398326 pCaiF] IN NUMBERS
| Condition | Exponential phase [RiPS/O.D.] | Stationary phase [RiPS/O.D.] |
|---|---|---|
| LB | 1.2516E+07 | -8.6245E+05 |
| 0.5LB | 1.8101E+07 | -2.5945E+05 |
| 10g/L | 6.6456E+06 | -6.7109E+06 |
| 5g/L | 8.3673E+06 | 4.2339E+06 |
| 2g/L | 7.2869E+06 | 3.9755E+07 |
| 1g/L (glucose) | 7.4517E+06 | 2.1543E+07 |
| 1g/L (Laurate) | 1.1435E+07 | 6.6428E+06 |

 "
"
