Team:TU Delft/Project/solubility/characterization
From 2010.igem.org
(→Characterization of the Hydrocarbon Solubility Parts) |
(→Our Emulsifier Assay) |
||
| Line 19: | Line 19: | ||
[[Image:TU_Delft_sudan_ii_balls_stick.png|thumb|250px|right|Ball-and-stick model of the Sudan II molecule. Source [http://commons.wikimedia.org/wiki/File:Sudan-II-3D-balls.png Wikipedia]]] | [[Image:TU_Delft_sudan_ii_balls_stick.png|thumb|250px|right|Ball-and-stick model of the Sudan II molecule. Source [http://commons.wikimedia.org/wiki/File:Sudan-II-3D-balls.png Wikipedia]]] | ||
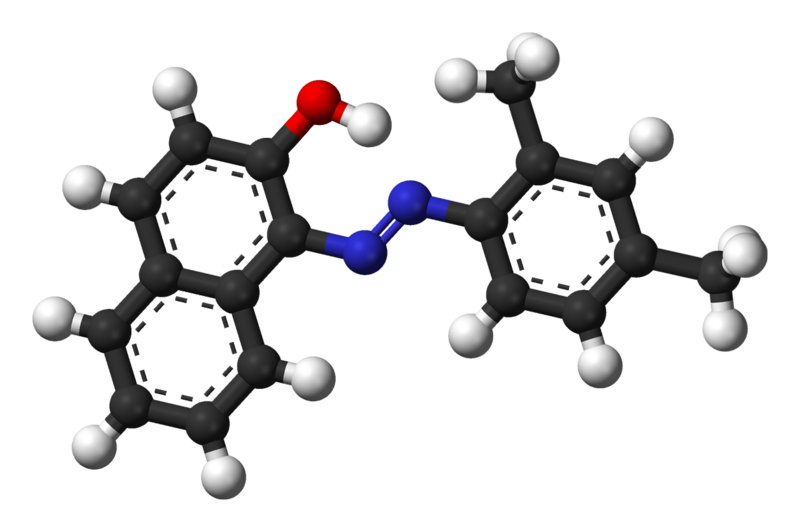
| - | For determining the emulsification capacity of a substance we developed our own emulsifier assay. The main difference to the | + | For determining the emulsification capacity of a substance we developed our own emulsifier assay. The main difference to the existing assays is that instead of emulsifying a colorless hydrocarbon, we added the orange Sudan II dye. This molecule stains non-polar molecules and hardly dissolves in water. The addition of the dye makes measuring the emulsification much easier, because of it’s nice absorbance peak at 493 nm. |
Read the [[Team:TU_Delft/Notebook/protocols|Emulsification Assay protocol]]. | Read the [[Team:TU_Delft/Notebook/protocols|Emulsification Assay protocol]]. | ||
Revision as of 20:24, 26 October 2010

Characterization of the Solubility Parts
Protein Production Analysis
The alna gene was induced when the culture reached a density of about 108 bacteria per mL. Bacterial and medium samples were taken for sodium dodecyl sulfate (SDS)-gel electrophoresis to monitor AlnA production. Because the IPTG inducable protomor is generally regarded as verey strong, we expect that the resulting gel wil show when the expression of AlnA begins and when it reaches its maximum.
Standard Emulsifier Assays
Besides proving the production of the protein, we wanted to measure the increase of emulsification as well. The only problem was that emulsification is not easily determined. In literature we found many methods that involve spectrophotometric measurements of turbidity after mixing. Although many articles show nice graphs, we were unable to reproduce them. So, in our opinion measuring turbidity is rather arbitrary and there is a clear need for a new emulsification assay.Example from literature
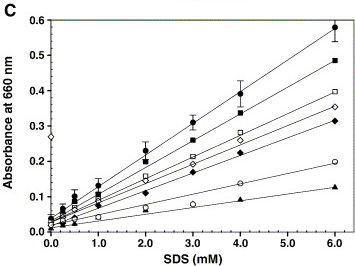
Figure 1 on the right shows a calibration graph with a linear increase in absorbance at 660 nm for increasing concentrations of SDS (●). Under the standard detergent assay conditions, various components like 200 mM NaCl (□), 2.0 mM CaCl2 (♦), 10% glycerol (■), 100 μg microsomal membranes (open diamond), 0.2 mM Triton X-100 (▲) and 2.5 mM CHAPS (○) were added and the turbidity was measured. Error bars represent the deviation from five independent experiments and each one performed in duplicate. Rajakumari et al (2006) Biochemical and Biophysical Methods
Our Emulsifier Assay
For determining the emulsification capacity of a substance we developed our own emulsifier assay. The main difference to the existing assays is that instead of emulsifying a colorless hydrocarbon, we added the orange Sudan II dye. This molecule stains non-polar molecules and hardly dissolves in water. The addition of the dye makes measuring the emulsification much easier, because of it’s nice absorbance peak at 493 nm.
Read the Emulsification Assay protocol.
Calibration
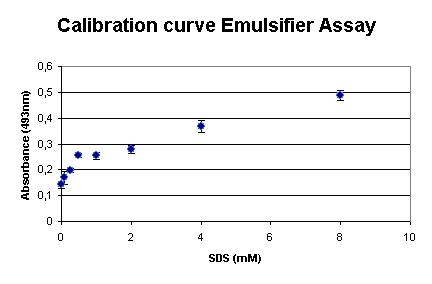
The assay was calibrated using SDS, because this detergent is widely used and makes the outcome of the assay comparable to existing assays. Our measurements are shown in the graph on right. It shows that the assay is very sensible at low SDS concentrations.
Background
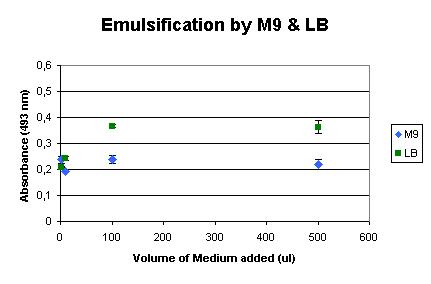
Next, the influence of the culture media was determined. We used LB medium for the initial growth of the cells, and induced the production of AlnA in M9 medium. The background influence of the media on the assay were measured, as shown below. It shows that LB medium already has some emulsification effect, but M9 shows very little influence.

 "
"


