Team:Aberdeen Scotland/GFP decay
From 2010.igem.org
| Line 38: | Line 38: | ||
<tr> | <tr> | ||
<td align="center"> | <td align="center"> | ||
| - | <a href="https://2010.igem.org/Team:Aberdeen_Scotland/Results"><img src="https://static.igem.org/mediawiki/2010/8/8e/Left_arrow.png"> Return to Results</a> | + | <a href="https://2010.igem.org/Team:Aberdeen_Scotland/Results"><img src="https://static.igem.org/mediawiki/2010/8/8e/Left_arrow.png"> Return to Results Main Page</a> |
</td> | </td> | ||
</tr> | </tr> | ||
Revision as of 12:00, 26 October 2010
University of Aberdeen - ayeSwitch
Characterising the glucose repression of GAL1 promoter in the GAL1p-[Npeptide-GFP] construct
Aim
To test the effect of glucose on repression of the GAL1 promoter, and thus on shut-off of GFP expression from construct GAL1p-[Npeptide-GFP] construct over time.
Hypothesis
The presence of glucose should quickly repress the GAL1 promoter and therefore result in the overall reduction of the GFP intensity present within the cells; measurement of the rate of decay should identify the relative stability of the GFP protein
Protocol
1. Yeast transformed with the GAL1p-[Npeptide-GFP] construct were innoculated overnight in 5 mls of synthetic defined medium with amino acids; his (0.2 %), met (0.2%), ura (0.2%), trp (0.2 %) and Raffinose (2 %) as the carbon source.
2. Following overnight growth the cells were subcultured in fresh, pre-warmed SD medium (50 mls) containing galactose (a range of concentrations: see Results below) to obtain a predicted OD600 of 0.3 by 10 am the following morning.
3. The following morning, at an OD600 of 0.3, a sample (1 ml) was taken before and after the addition of glucose (2 %). Samples were then taken every 20 minutes thereafter for a period of 167 minutes. All samples were then pelleted (13000 rpm, 5 mins, 4 degreesC), washed once with PBS buffer and stored on ice. Once collected all samples were then dispenced in PBS and diuted by a factor of 1/20 for FACS analysis.
Results
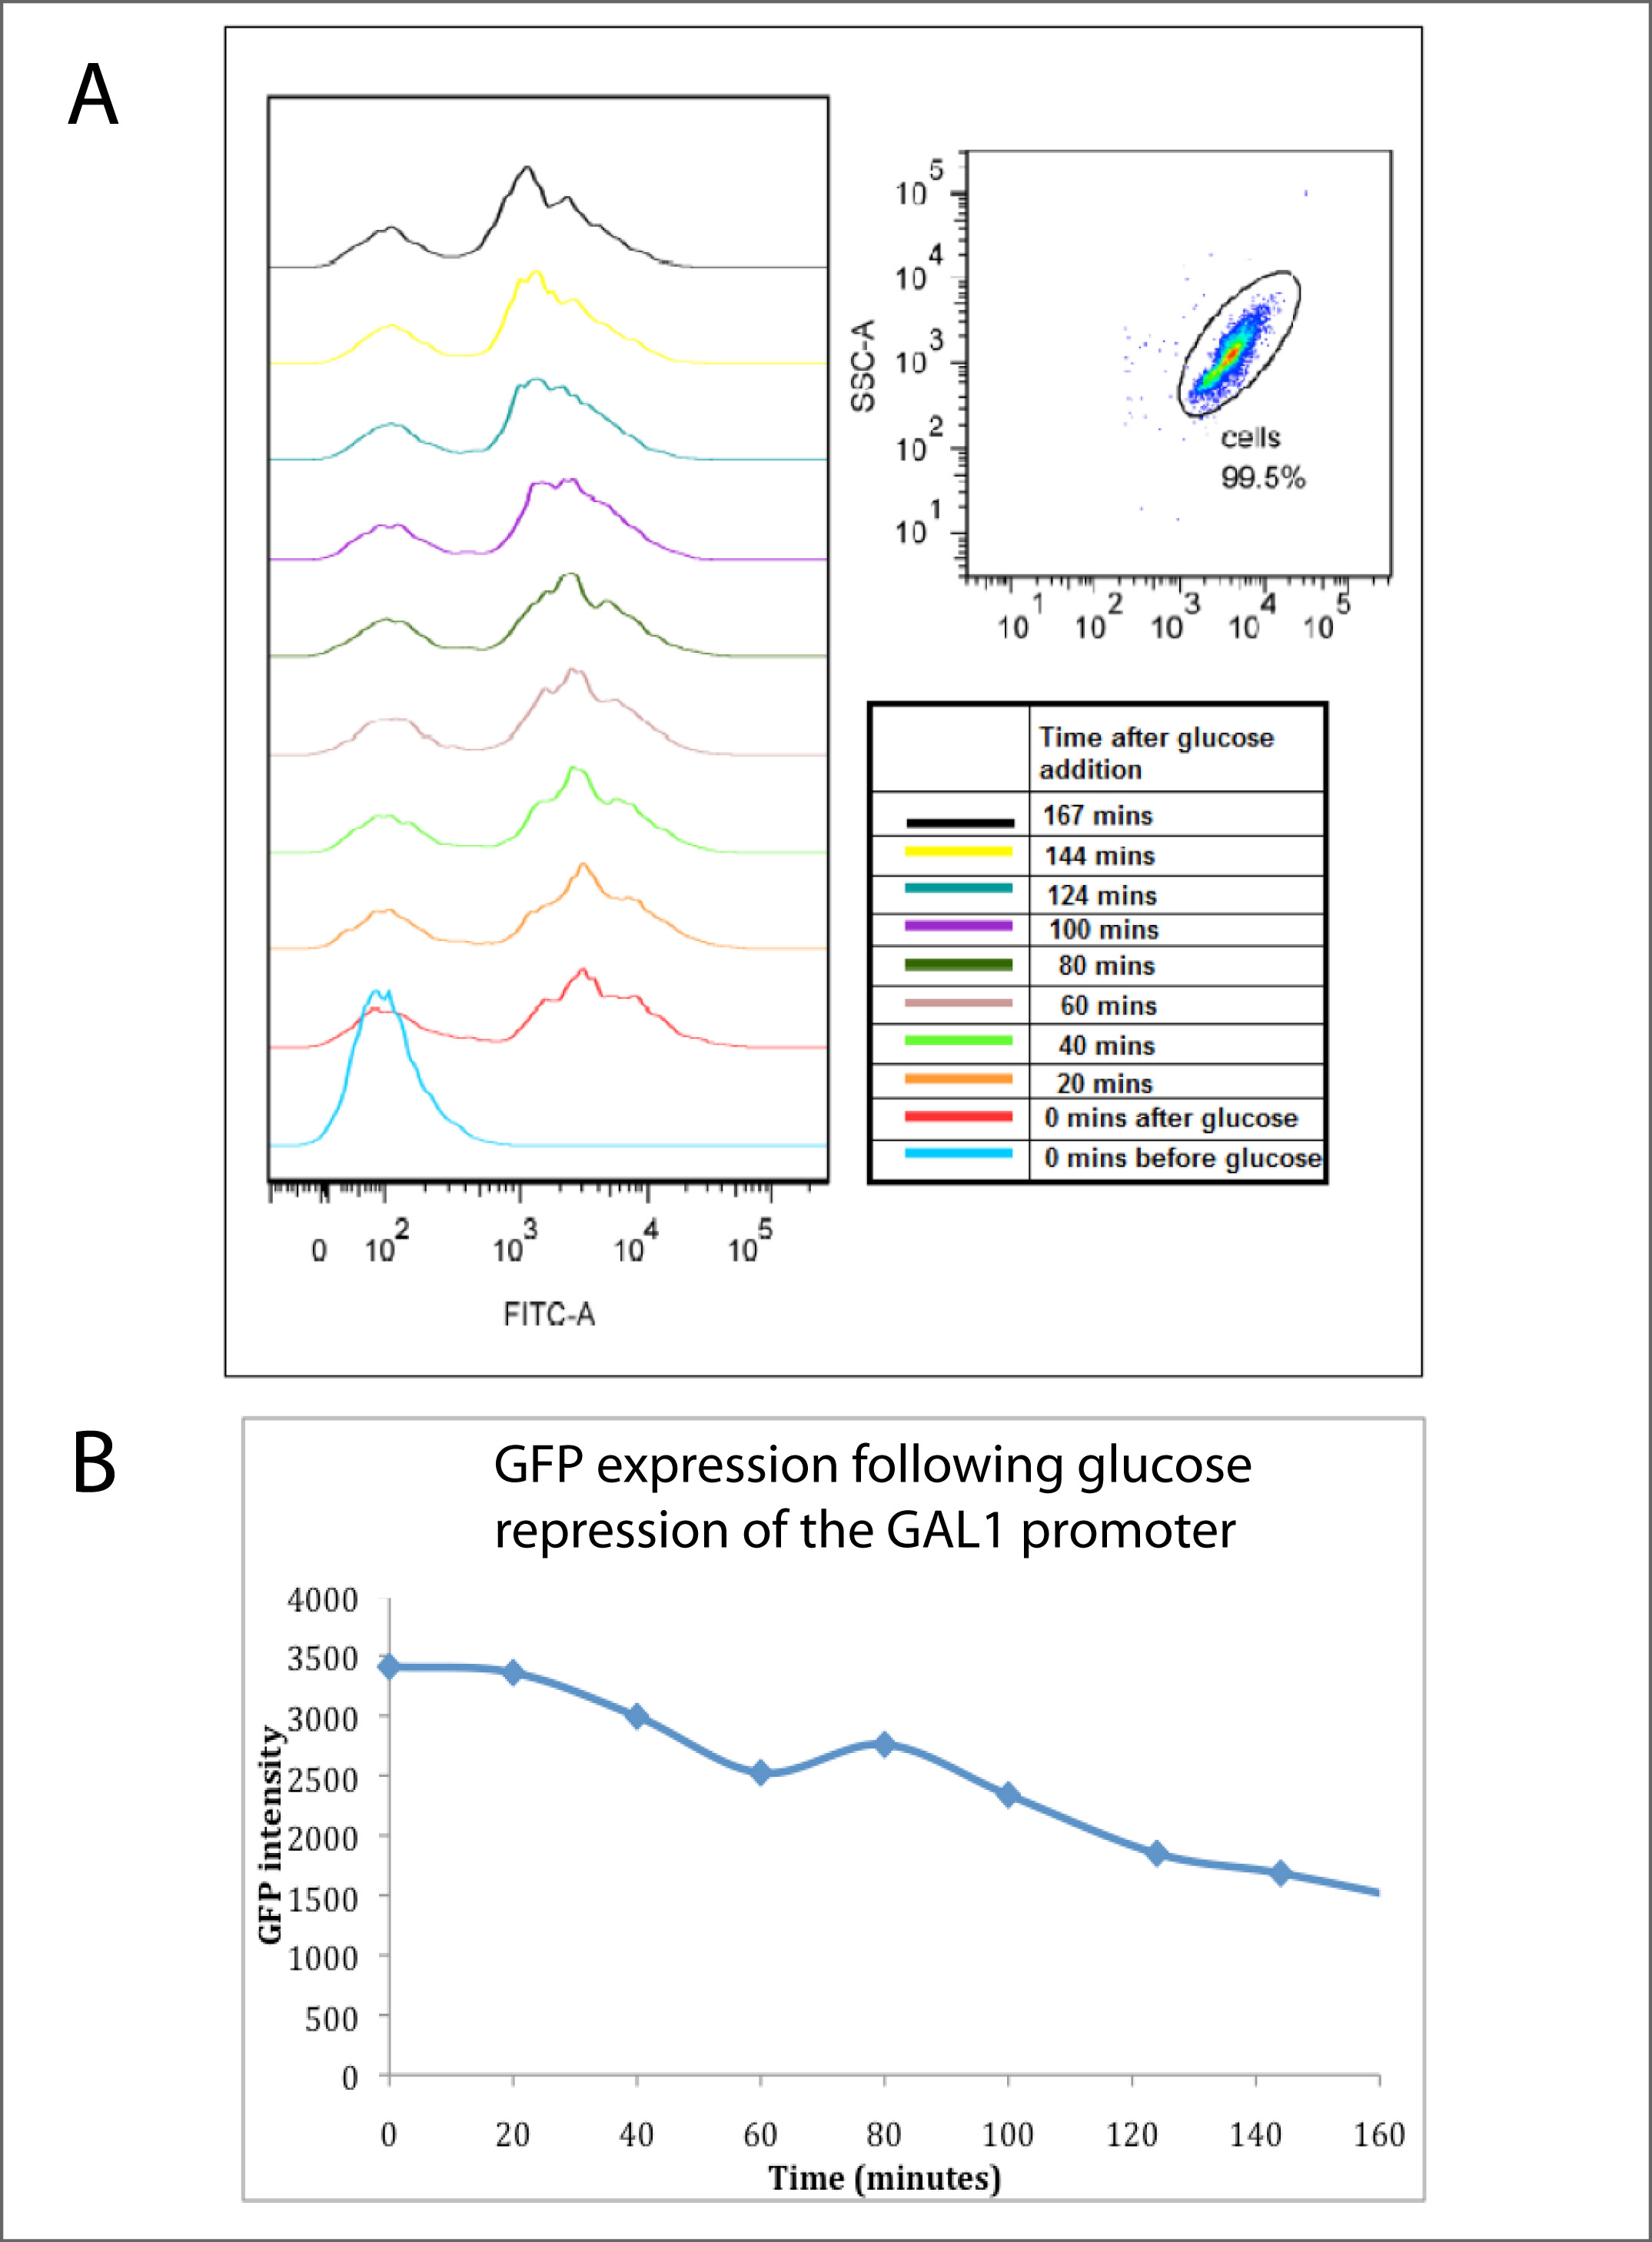
Cells grown on galactose and expressing GFP were switched to growth on medium containing glucose. Following the resultant switch-off of the GAL1 promoter, GFP decay was monitored.
Panel A (below) shows FACS analysis, with the peak to the left indicating GFP expressing cells and a peak to the right showing non GFP expressing cells. The FACS analysis clearly shows that the highest GFP expression (bottom light blue line) is observed after incubation overnight with galactose, with glucose present. It can be observed that after the addition of glucose (all lines above the blue) that there is a continuous increase in the number of cells not expressing GFP over time.
Panel B shows this data in summarised, averaged form. It reveals that the average GFP intensity of the cells decreased steadily with time after the glucose addition, hence showing that the glucose has rapidly repressed the GAL1 promoter,and inhibited the expression of GFP. The half-life of this decay was approximately 140 minutes, which corresponded to approximately the doubling time of the cell culture, indicating that cell division was the primary reason for GFP disappearance, rather than active GFP turnover.
Conclusion
The presence of glucose rapidly inhibits the GAL1 promoter from expressing GFP and the average GFP intensity within a cell reduces by over 50 % within 140 minutes, consistent with cell division being the primary source of GFP depletion. This confirmed the fact that GFP is widely considered to be an extremely stable protein.
 Return to Results Main Page Return to Results Main Page
|
 "
"
