Team:Stockholm/16 August 2010
From 2010.igem.org
NinaSchiller (Talk | contribs) (→Agarose gel on fusion protein) |
|||
| Line 108: | Line 108: | ||
*'''Plasmid prep.:''' 5 ml LB + 25 μg/ml Cm. 37 °C, 250 rpm. | *'''Plasmid prep.:''' 5 ml LB + 25 μg/ml Cm. 37 °C, 250 rpm. | ||
*'''Glycerol stock:''' 3 ml LB + 25 μg/ml Cm. 30 °C. | *'''Glycerol stock:''' 3 ml LB + 25 μg/ml Cm. 30 °C. | ||
| + | |||
| + | {{Stockholm/Footer}} | ||
Latest revision as of 10:52, 26 October 2010
Contents |
Nina
Colony PCR
I performed a colony PCR in order to screen for the fusion protein (protein A and IgG protease)on both dish nr 1 and 2 (5 colonies from each dish).
PCR Master mix 10 tubes:
- Mgcl2 50 mM 10 ul
- Phusion buffer 5X 100 ul
- dNTP 10 mM 10 ul
- primerF 549 (protein A) 5 uM 30 ul
- primerR 560 (IgG protease) 5 uM 30 ul
- PjuX7 10 ul
- H2O 300 ul
I added 49 ul to each PCR tube. Before adding the mixture to each PCR tube I transfered about half of a colony of interest into the tube and microwaved it for 1 min. This is to lyse the bacteria before PCR it.
PCR prgm:
Agarose gel on fusion protein
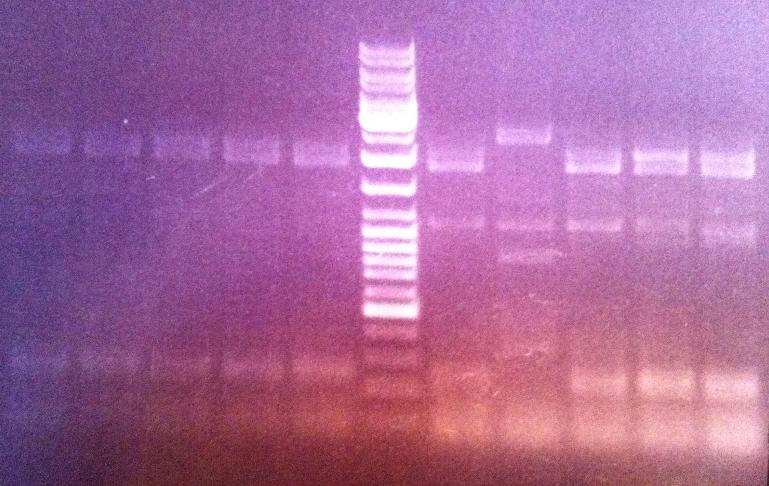
I ran an agarose gel 1 % 80 V on the PCR products in order to verify that the fusion of protein A and IgG protease has actually occured.
Ladder: GeneRuler™ DNA Ladder Mix, ready-to-use, 100-10,000 bp Fermentas
Arragement on gel:
Unfortunately I did not obtain any band that seemed to correspond to the correct fusion protein size, therefore I will re-do the screen and the next time test 39 colonies. If I do not obtain any good results from that screen then I will perform a new ligation.
Colony PCR
I did a new screen to check if I have any fusion protein. This time I screened 39 colonies.
PCR Master mix 40 tubes:
- Mgcl2 50 mM 40 ul
- Phusion buffer 5X 400 ul
- dNTP 10 mM 40 ul
- primerF 549 (protein A) 5 uM 120 ul
- primerR 560 (IgG protease) 5 uM 120 ul
- PjuX7 40 ul
- H2O 1200 ul
I added 49 ul to each PCR tube. Before adding the mixture to each PCR tube I transfered about half of a colony of interest into the tube and microwaved it for 1 min.
PCR prgm:
2 min elongation time.
Andreas
Site-directed mutagenesis
Gel verification
Continued from 13/8 colony PCR amplifications
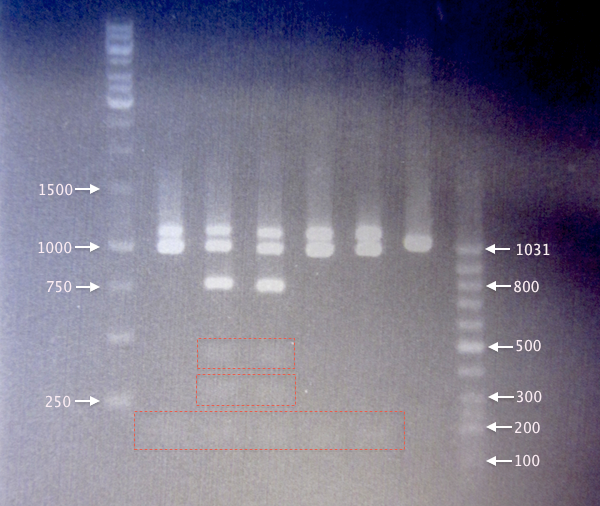
- Digested yCCS samples.
- 1 % agarose; 90 V, 20 min; 70 V, 40 min.
- 3 μl DNA ladder, 3 μl sample.
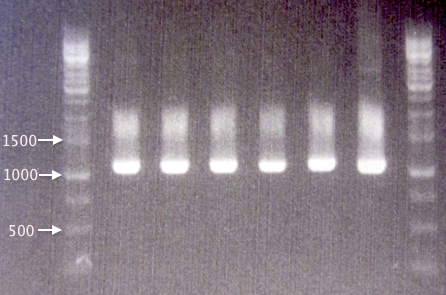
- Undigested yCCS samples.
- 1 % agarose, 70 V, 50 min.
- 3 μl DNA ladder, 3 μl sample.
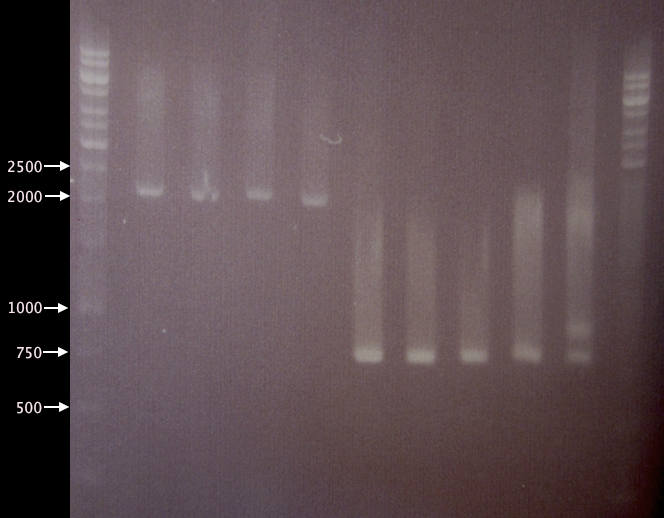
- SOD samples.
- 1 % agarose, 80 V, 1h 10 min.
- 3 μl DNA ladder, 3 μl sample.
Expected bands:
- Undigested yCCS: 1076 bp
- Digested yCCS
- Non-mutagenized: 124 bp, 259 bp, (377 bp), 705 bp, (958 bp), 1076 bp
- Mutagenized (EcoRI site removed): 124 bp, 958 bp, 1076 bp
- SOD: 791 bp
- Pos. control (BBa_J18932): 1037 bp
Parenthesized number denote partly digested products. Underlined numbers denote undigested products.
Results
- Digested yCCS samples. It seems like SA2 and SA3 origin from non-mutagenized clones, as they result in 6 bands. In contrast, SA1, SA4 and SA5 result in three bands.
Band sizes are slightly larger than expected for all digested samples. This may be the result of something influencing the DNA migration speed, possibly the restriction enzymes or the FD green buffer salts. - Undigested yCCS samples. Bands corresponding well to expected sizes of undigested yCCS (1076 bp). Also, the positive control, BBa_J18932, resulted in a slightly smaller band, as expected (1037 bp).
Results from 1. and 2. together indicate successful mutagenesis/EcoRI removal and verified clones for yC1, yC4 and yC5. - SOD samples. Since clones SA1-SA4 were not even supposed to grow on Amp plates, it is quite puzzling that these clones resulted in bands using verification primers pSB-VF2 and pSB-VR; this indicates that these cells probably carry BioBrick plasmids.
Clones SC1-SC5 all results in bands of ≈740 bp, which is smaller than expected (791 bp). SC5 also displays a second band at about 850 bp. However, I was unable to verify any of the picked SOD clones.
Colony PCR
Four new colonies (S1-S4) were picked from the 12/8 SOD plates for verification by colony PCR. The pSB1C3.SOD A plasmid was used as positive control (PC), as it is the plasmid sample used for site-directed mutagenesis.
Procedures as described in colony PCR protocol. Elongation time: 1:30.
Gel verification
- 1 % agarose, 90 V, 50 min.
- 3 μl DNA ladder, 3 μl sample.
Results
All four picked clones corresponding well to the 791 bp-bands expected. The band size was also identical to that of the non-mutagenized SOD A sample plasmid, further indicating that the clones are correct-sized.
ON cultures
yCCS clones yC1 and yC4 and SOD clones S1 and S2 were chosen for plasmid prep and glycerol stock prep. Each clone was grown ON as follows:
- Plasmid prep.: 5 ml LB + 25 μg/ml Cm. 37 °C, 250 rpm.
- Glycerol stock: 3 ml LB + 25 μg/ml Cm. 30 °C.
 |

|
 |

|
 |

|

|

|
 "
"


