Team:Kyoto/Project/Goal A
From 2010.igem.org
(→Introduction) |
(→Method) |
||
| Line 13: | Line 13: | ||
[[Image:KyotoFigA003.png|300px]] | [[Image:KyotoFigA003.png|300px]] | ||
| + | [[Image:KyotoFigA004.png|300px|right]] | ||
We pick up three colony from each plate, and cultivate them in M9 medium for 16 hours. The overnight cultures were diluted to 1:100 in pre-warmed fresh M9 medium. 3h later and 3.5h later, we measure OD600 of the culture and GFP fluorescence in the culture. | We pick up three colony from each plate, and cultivate them in M9 medium for 16 hours. The overnight cultures were diluted to 1:100 in pre-warmed fresh M9 medium. 3h later and 3.5h later, we measure OD600 of the culture and GFP fluorescence in the culture. | ||
Revision as of 05:14, 26 October 2010
Contents |
Goal A: Characterization of R0011, a strong lactose promoter
Introduction
We used <partinfo>R0011</partinfo>, a lactose promoter, in the experiment of lysis box.
Because part parameters of R0011 are not decided perfectly (http://partsregistry.org/Part_Parameters), we characterized R0011 in order to characterize lysis cassette. We characterize R0011 by Relative Promoter Unit (RPU). When absolute promoter activity is measured at various test condition and measurement instruments, there is variation in promoter activity. RPU can reduce this Coefficient of variation (CV) from 39.1% to 17.5%. Therefore RPU can make it easier for us to share the data of promoter activity.
Method
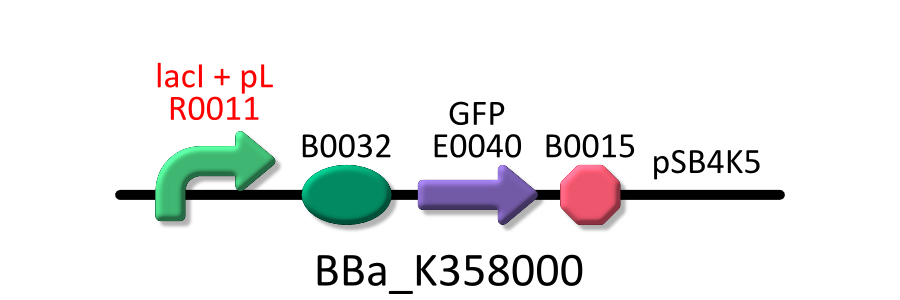
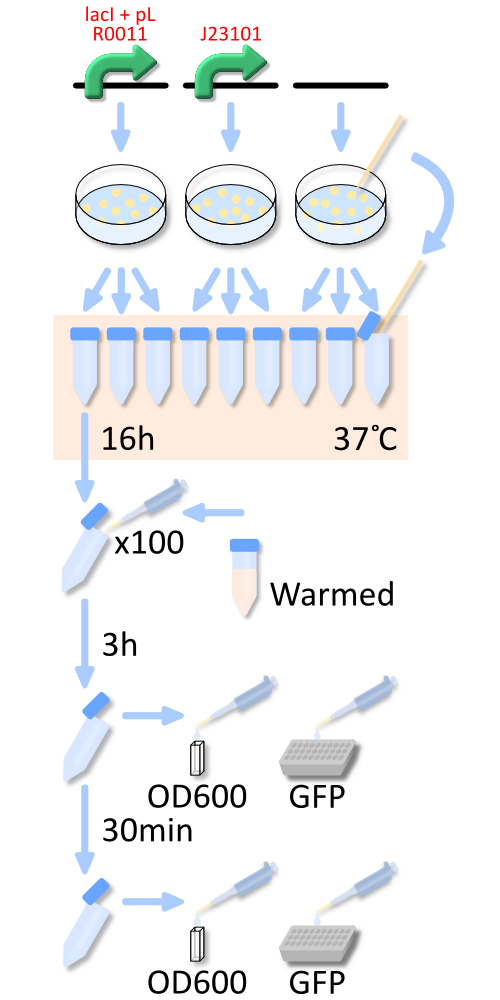
In order to measure RPU of R0011, we use three types of E.coli, E.coli KRX transformed with <partinfo>BBa_K358000</partinfo>, KRX transformed with <partinfo>BBa_K358001</partinfo>, KRX transformed with <partinfo>pSB4K5</partinfo> without insert.
We pick up three colony from each plate, and cultivate them in M9 medium for 16 hours. The overnight cultures were diluted to 1:100 in pre-warmed fresh M9 medium. 3h later and 3.5h later, we measure OD600 of the culture and GFP fluorescence in the culture.
RPU is calculated as follows.
RPU=(dFφ/dt)/ABSφ(dFJ23101/dt)/ABSJ23101
Result
The result of characterization is shown in table and figure below.
| IPTG (mM) | RPU | |||||
|---|---|---|---|---|---|---|
| A | B | C | Average | Stdev | CV | |
| 0.01 | 0.0191 | 0.00963 | 0.00244 | 0.0104 | 0.0084 | 0.806 |
| 0.03 | 0.177 | 0.155 | 0.198 | 0.174 | 0.0173 | 0.0997 |
| 0.1 | 0.205 | 0.191 | 0.269 | 0.221 | 0.0416 | 0.188 |
| 0.3 | 0.938 | 0.955 | 0.955 | 0.949 | 0.00981 | 0.0103 |
| 0.5 | 0.263 | 0.354 | 0.408 | 0.342 | 0.0733 | 0.215 |
| 0.8 | 1.44 | * | 1.21 | 1.37 | 0.161 | 0.122 |
| 1.0 | 1.60 | 1.58 | 1.65 | 1.65 | 0.106 | 0.0640 |
| 2.0 | 1.49 | 1.83 | 1.39 | 1.57 | 0.233 | 0.148 |
- *One of RPU in IPTG 0.8mM couldn’t measured.
Modeling
We make the model about the activity of R0011 and decide parameters from the result. The result is also drawn in figure above. To know more about this model, see Modeling.
Discussion
The result indicates that the maximum activity of R0011 is about 1.6 RPU and the minimum is less than 0.01 RPU and R0011 has wide range of activity (maximum activity of R0011 is about 160 fold greater than the minimum activity at least). The wide range of activity of RPU can change the effect of lysis cassette largely, and it is useful to characterize lysis cassette. CV in 0.01mM IPTG is 0.806, so large, we cannot trust RPU in 0.01mM ITPG so much.
 "
"


