Team:TU Delft/Project/tolerance/results
From 2010.igem.org
(Difference between revisions)
Ravandervalk (Talk | contribs) (→Alkane tolerance) |
Ravandervalk (Talk | contribs) |
||
| Line 1: | Line 1: | ||
| - | =Salt tolerance= | + | ==Salt tolerance== |
We tested the growth of our bbc1 construct (biobrick # K398108) as stated in our characterization page. | We tested the growth of our bbc1 construct (biobrick # K398108) as stated in our characterization page. | ||
| Line 6: | Line 6: | ||
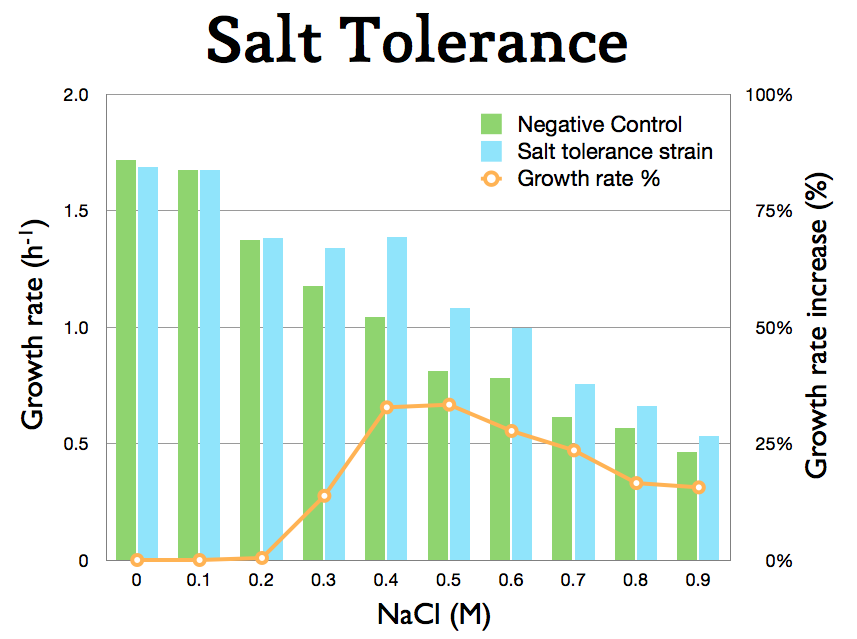
The results are visible in the following chart. | The results are visible in the following chart. | ||
| - | + | [[Image:TU_Delft_Salt_tolerance.jpg]] | |
| - | + | ||
Here one can see that the biobrick is indeed functional at concentrations greater then 0.3 M Sodium Chloride. | Here one can see that the biobrick is indeed functional at concentrations greater then 0.3 M Sodium Chloride. | ||
The general increase in tolerance varies between 10 and 35% depending on the Sodium Chloride concentration. | The general increase in tolerance varies between 10 and 35% depending on the Sodium Chloride concentration. | ||
| + | |||
| + | ==Alkane tolerance== | ||
Revision as of 12:13, 15 October 2010
Salt tolerance
We tested the growth of our bbc1 construct (biobrick # K398108) as stated in our characterization page.
The growth rates were determined for the exponential fase (using a trendline). The results are visible in the following chart.
Here one can see that the biobrick is indeed functional at concentrations greater then 0.3 M Sodium Chloride. The general increase in tolerance varies between 10 and 35% depending on the Sodium Chloride concentration.
 "
"
