Team:TzuChiU Formosa/Modeling
From 2010.igem.org
| Line 23: | Line 23: | ||
[[Image:Synthesis1.jpg|500px]] | [[Image:Synthesis1.jpg|500px]] | ||
| - | + | ||
===constitutive promoter-CrtEBIY (Demonstration of Synthesis System)=== | ===constitutive promoter-CrtEBIY (Demonstration of Synthesis System)=== | ||
Growth Curve of Synthesis System E. coli <br> | Growth Curve of Synthesis System E. coli <br> | ||
| - | To verify the beta-carotene production by our synthesis system E. coli ( | + | To verify the beta-carotene production by our synthesis system E. coli (DH5α), which contains the part BBa_k419012 (beta-carotene producing genes CrtEBIY with constitutive promoter) in the iGEM 2010 standard backbone pSB1C3, the bacterial culture of our synthesis system was performed and the growth curve was determined in the experiment. |
Single colony of our synthesis system or control (without beta-carotene genes) bacteria was inoculated into LB medium containing 34 μg/ml chloramphenical , then incubated at 37℃ overnight. The next day, the absorbance of the overnight cultures was measured at 600 nm and 0.1 OD of diluted bacterial culture (1 ml) was inoculated into 40 ml fresh LB/chloramphenical broth, then grow the culture at 37℃ incubator. We aliquot the bacterial culture (1 ml) every 2 hours and measured the bacterial growth by spectrophotometer at 600nm. Finally, we determine and draw the bacterial growth curve of our synthesis system E. coli. The Figure shows the growth curve of our synthesis system or control E. coli. The result shows that both control (green curve) and synthesis system (synthesizer, orange curve) E. coli reached to plateau at 8 h and grown equally well. We prove that the growth of synthesis system (containing part BBa_k274200) is well in the same growth condition compared with control.<br> | Single colony of our synthesis system or control (without beta-carotene genes) bacteria was inoculated into LB medium containing 34 μg/ml chloramphenical , then incubated at 37℃ overnight. The next day, the absorbance of the overnight cultures was measured at 600 nm and 0.1 OD of diluted bacterial culture (1 ml) was inoculated into 40 ml fresh LB/chloramphenical broth, then grow the culture at 37℃ incubator. We aliquot the bacterial culture (1 ml) every 2 hours and measured the bacterial growth by spectrophotometer at 600nm. Finally, we determine and draw the bacterial growth curve of our synthesis system E. coli. The Figure shows the growth curve of our synthesis system or control E. coli. The result shows that both control (green curve) and synthesis system (synthesizer, orange curve) E. coli reached to plateau at 8 h and grown equally well. We prove that the growth of synthesis system (containing part BBa_k274200) is well in the same growth condition compared with control.<br> | ||
Revision as of 08:21, 4 December 2010
Contents |
Synthesis system
constitutive promoter-CrtEBIY (The Part BBa_k419012 )
Verification of the Part BBa_k419012
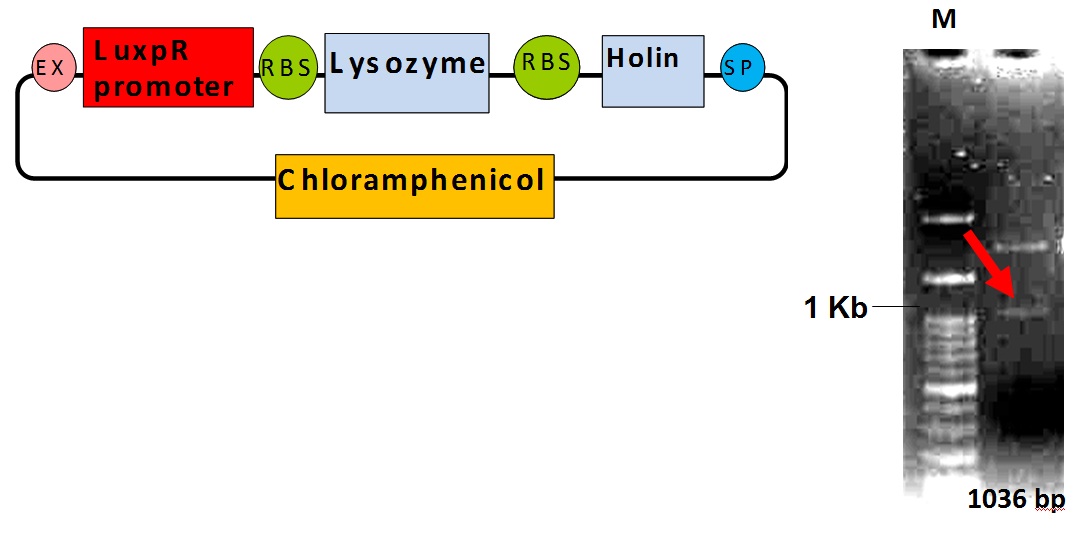
We use constitutive promoter to drive the CrtEBIY composite for beta-carotene synthesis. The CrtEBIY composite (BBa_K274210) was obtained from the distribution part of iGEM 2009 Cambrige and digested with restriction enzymes, EcoR I and Pst I, then ligated to EcoR I and Pst I sites of pSB1C3, the iGEM 2010 standard backbone. We verified our composite for synthesis system by EcoRI and PstI digestion and the agarose gel electrophoresis result was shown. The arrow (red) indicates the CrtEBIY with constitutive promoter (R001) DNA fragment. The synthesis system composite was transformed into DH5 E. coli for further experiment.
constitutive promoter-CrtEBIY (Demonstration of Synthesis System)
Growth Curve of Synthesis System E. coli
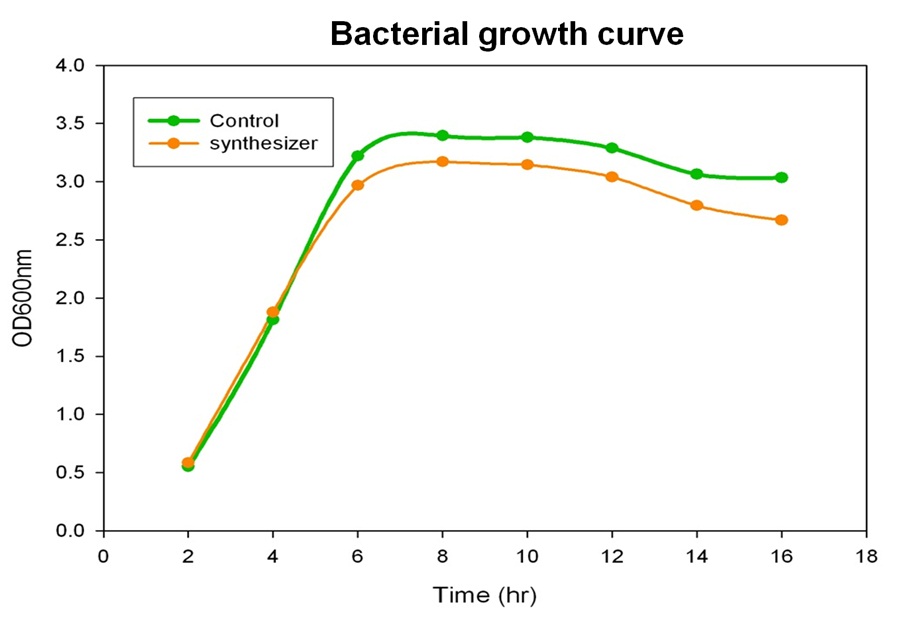
To verify the beta-carotene production by our synthesis system E. coli (DH5α), which contains the part BBa_k419012 (beta-carotene producing genes CrtEBIY with constitutive promoter) in the iGEM 2010 standard backbone pSB1C3, the bacterial culture of our synthesis system was performed and the growth curve was determined in the experiment.
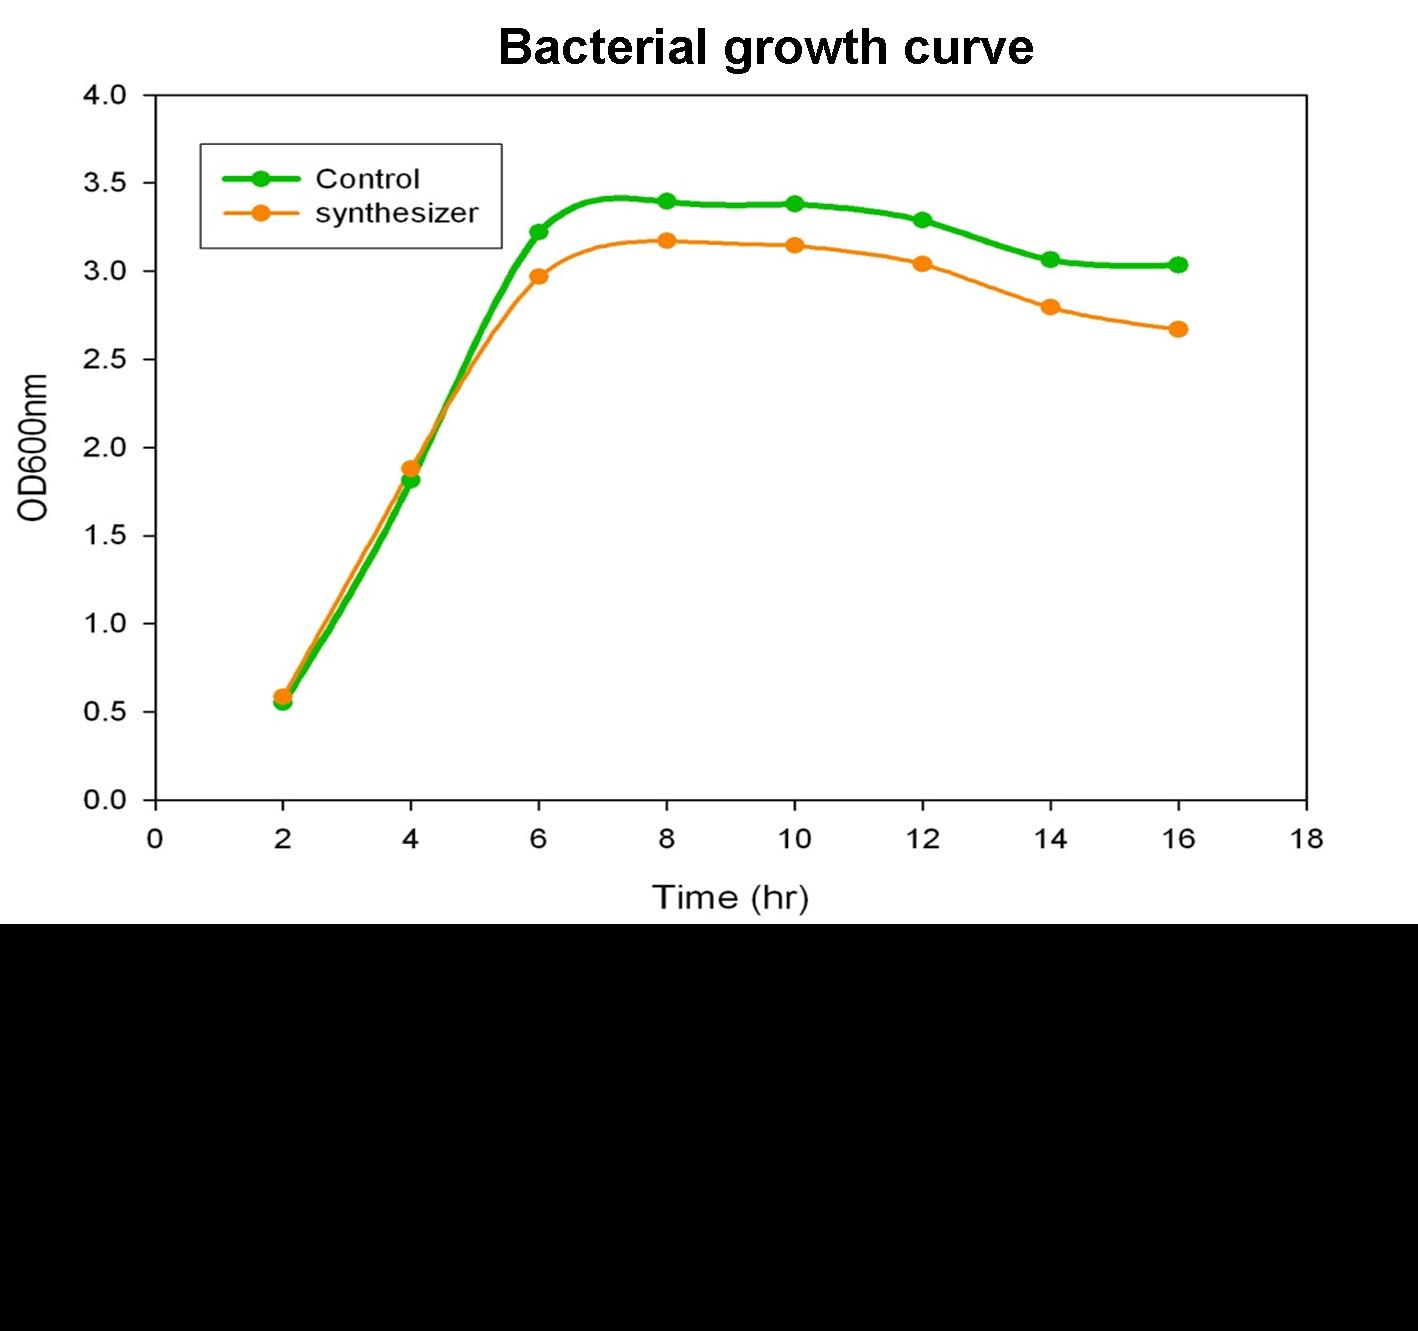
Single colony of our synthesis system or control (without beta-carotene genes) bacteria was inoculated into LB medium containing 34 μg/ml chloramphenical , then incubated at 37℃ overnight. The next day, the absorbance of the overnight cultures was measured at 600 nm and 0.1 OD of diluted bacterial culture (1 ml) was inoculated into 40 ml fresh LB/chloramphenical broth, then grow the culture at 37℃ incubator. We aliquot the bacterial culture (1 ml) every 2 hours and measured the bacterial growth by spectrophotometer at 600nm. Finally, we determine and draw the bacterial growth curve of our synthesis system E. coli. The Figure shows the growth curve of our synthesis system or control E. coli. The result shows that both control (green curve) and synthesis system (synthesizer, orange curve) E. coli reached to plateau at 8 h and grown equally well. We prove that the growth of synthesis system (containing part BBa_k274200) is well in the same growth condition compared with control.
Beta-carotene Productivity of Synthesis System E. coli
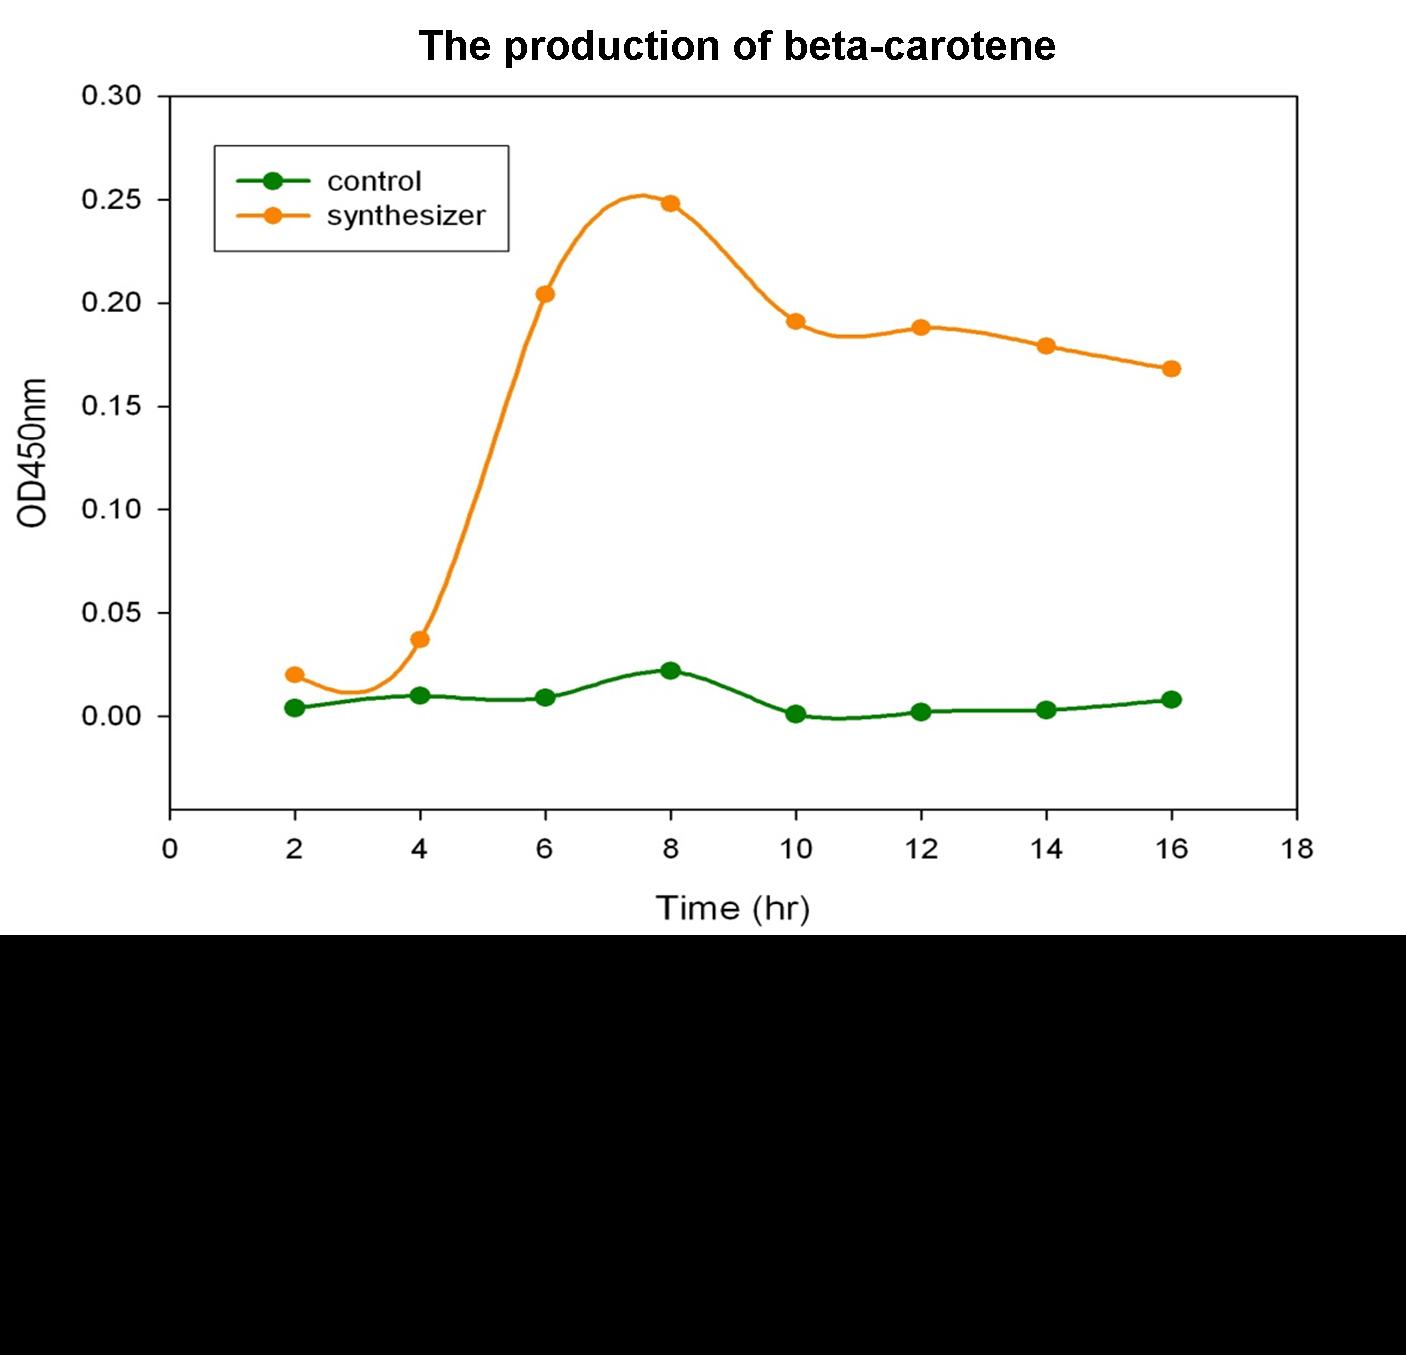
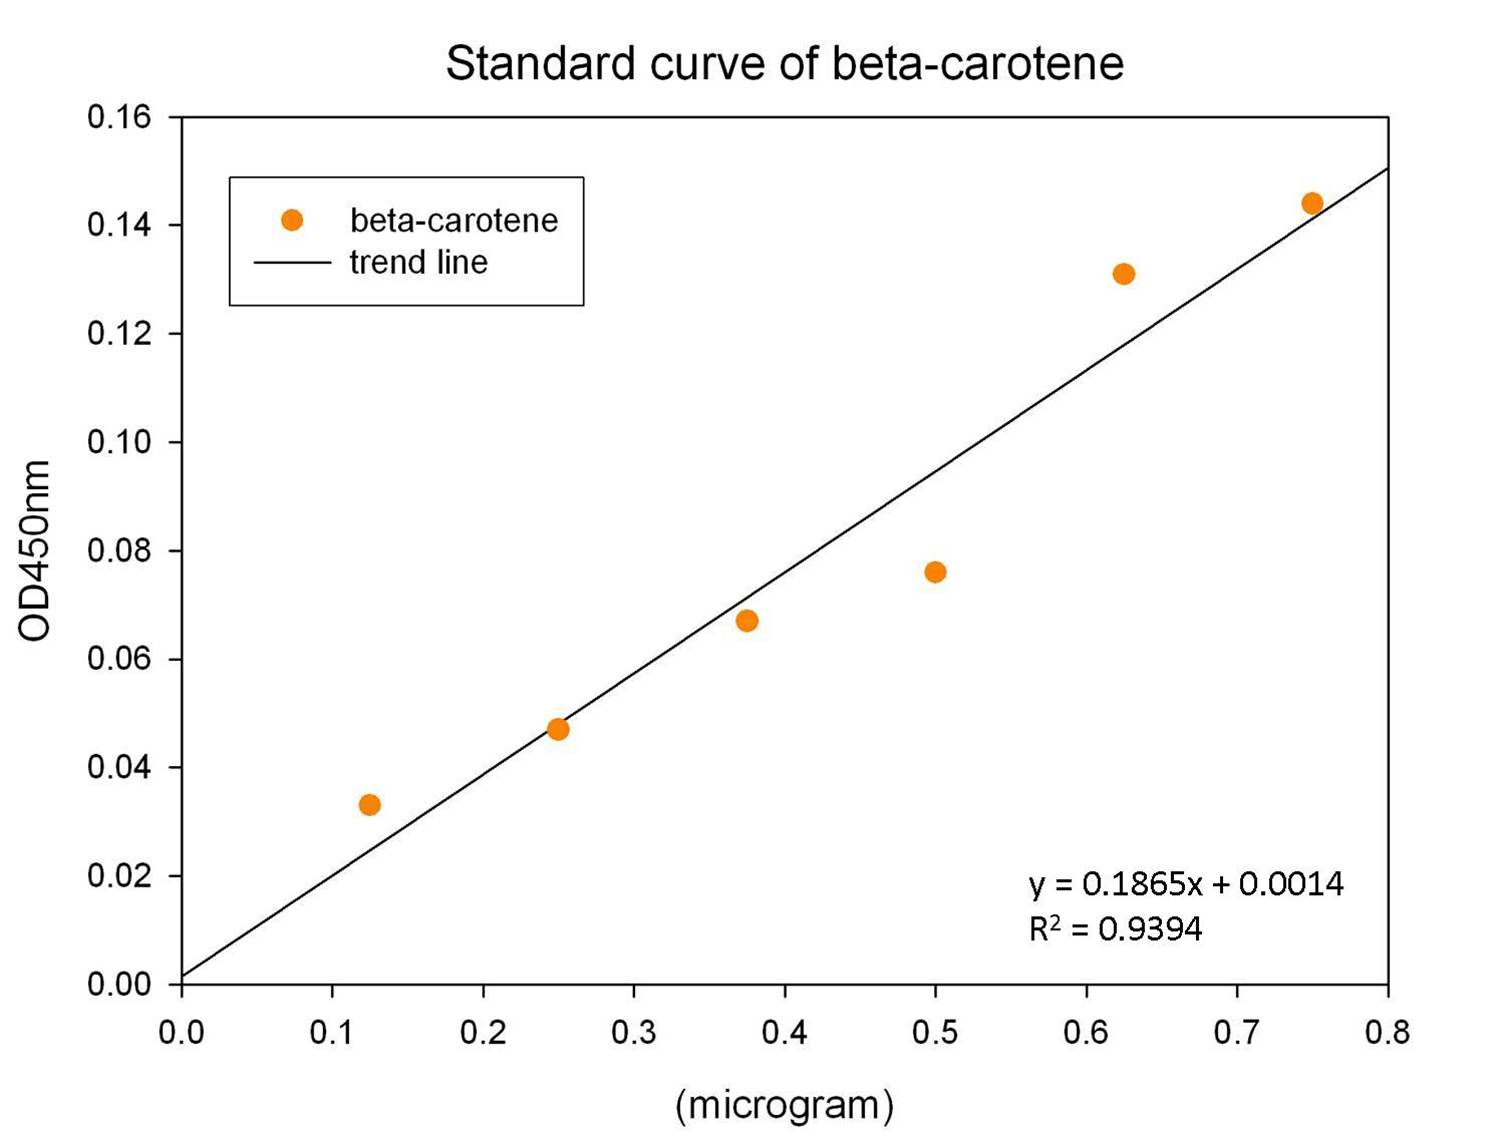
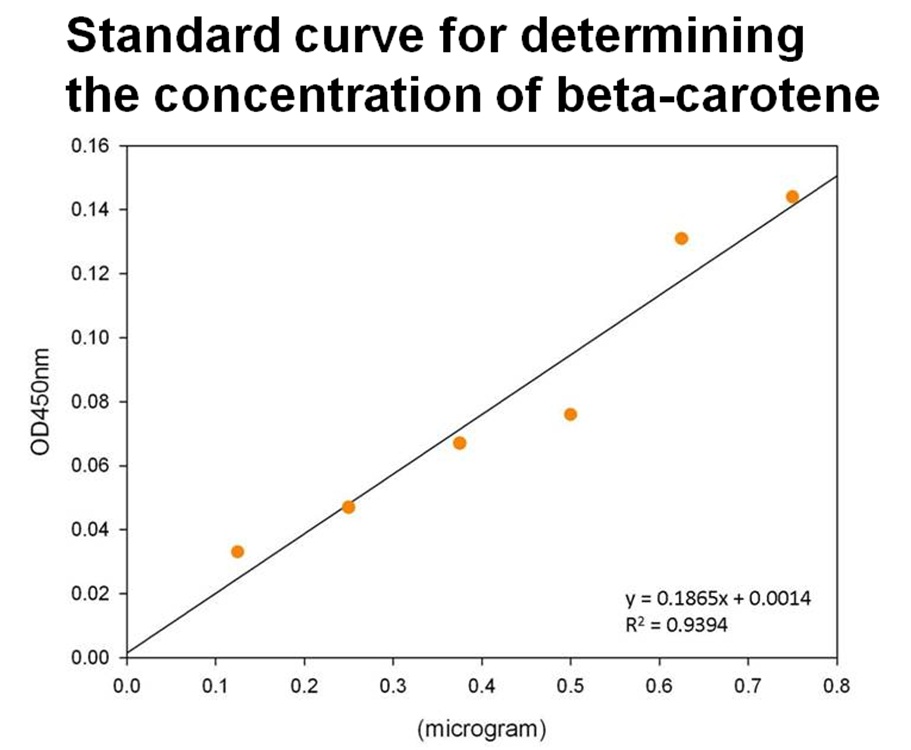
The level of beta-carotene production was measured every two hours. The beta-carotene produced by the synthesis system E. coli (1 ml) was extracted by acetone, then the absorbance was determined at 450nm by spectrophotometer. Figure shows the absorbance of beta-carotene. The result shows that that the level of the beta-carotene in our synthesis system contained part BBa_K419012 (synthesizer, orange curve) was elevated at 4 hour and reached a maximum level at 8 h. No beta-carotene was produced in the control E. coli (green curve).
Estimation of the bacterial numbers of synthesis system E. coli
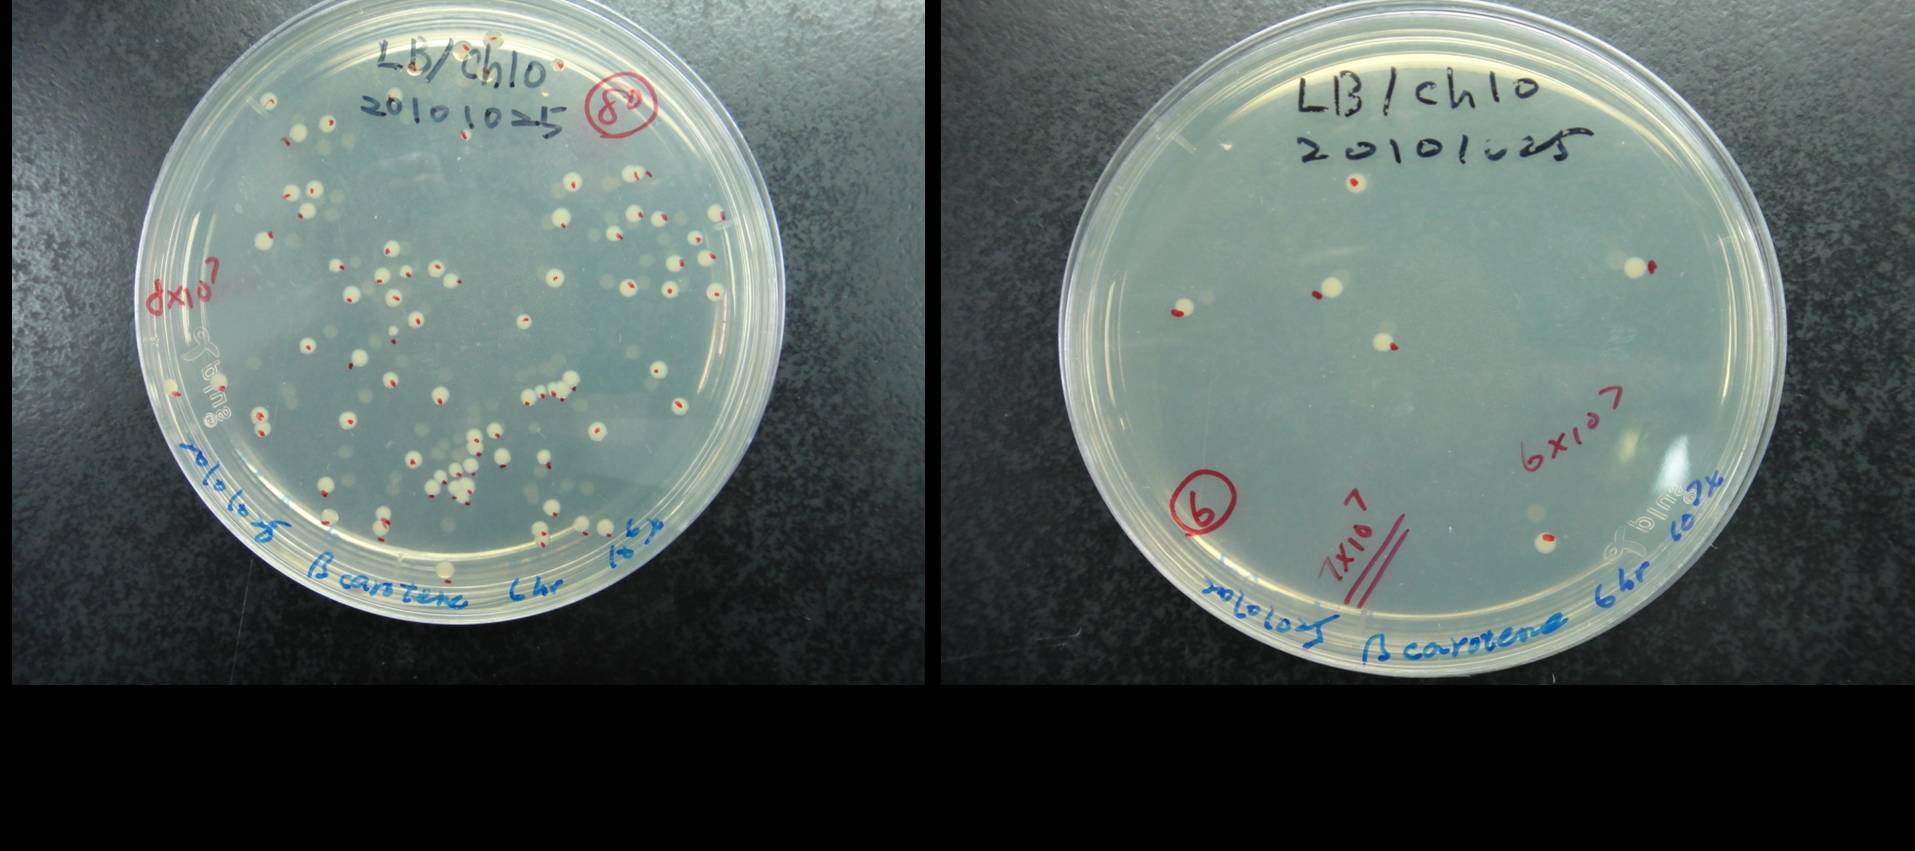
Figure shows that the calculation of the total number of the synthesis system E. coli. The bacterial cultures were series diluted and plated on LB agar contained cploramphenical. As shown in figure, we count the number of colony at 106x and 107x dilution of 6h bacterial culture. We calculate the average bacterial numbers at 6 h culture is 7x10⁸.
 "
"
