Existing Parts from the Registry: list
<partinfo>BBa_R0010</partinfo>, <partinfo>BBa_R0011</partinfo> - Wild type and hybrid lac promoters
<partinfo>BBa_R0011</partinfo> hybrid lac promoter and the <partinfo>BBa_R0010</partinfo> wild type lac promoter were characterized at different copy number in TOP10 E. coli strain. This strain contains a lacI expression system in the genome.
Induction static transfer function (computed in Relative Promoter Units), dynamics and metabolic burden were evaluated as a function of different IPTG concentrations in M9 supplemented with glycerol growth medium.
A RFP generator (<partinfo>BBa_I13507</partinfo>) was used as a reporter gene. In particular, these measurement systems were used:
- <partinfo>pSB1A2</partinfo>-<partinfo>BBa_J107010</partinfo>
- <partinfo>pSB1A3</partinfo>-<partinfo>BBa_J04450</partinfo>
- <partinfo>pSB4C5</partinfo>-<partinfo>BBa_J107010</partinfo>
- <partinfo>pSB4C5</partinfo>-<partinfo>BBa_J04450</partinfo>
At first, <partinfo>BBa_J107010</partinfo> and <partinfo>BBa_J04450</partinfo> inducibility was tested in a high copy number vector (<partinfo>pSB1A2</partinfo> or <partinfo>pSB1A3</partinfo>). The results are shown here as the relative RFP synthesis rate per cell.
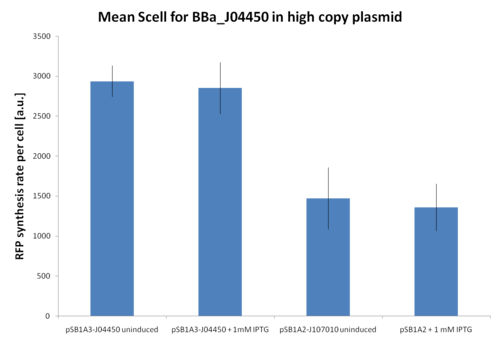 Relative RFP synthesis rate per cell in <partinfo>pSB1A2</partinfo>-<partinfo>BBa_J107010</partinfo> and <partinfo>pSB1A3</partinfo>-<partinfo>BBa_J04450</partinfo>. The error bars represent the standard errors of three independent measurements. |
Results show that in this condition <partinfo>BBa_R0010</partinfo> is about 2-fold stronger than <partinfo>BBa_R0011</partinfo>, but induced and uninduced cultures did not show differences in the RFP signal.
This result is expected because the vectors are propagated at about 200 copies per cell, while the lacI repressor is present at single copy in the genome and thus it is not able to repress the lac promoters in such high copy.
The doubling times and their standard errors estimated from data are reported below for <partinfo>pSB1A2</partinfo>-<partinfo>BBa_J107010</partinfo> and <partinfo>pSB1A3</partinfo>-<partinfo>BBa_J04450</partinfo> with and without 1mM of IPTG.
| Cultures | Mean doubling times [minutes] | standard errors over 3 independent experiment [minutes]
|
| <partinfo>pSB1A2</partinfo>-<partinfo>BBa_J107010</partinfo> | 77,7 | 3,1
|
| <partinfo>pSB1A2</partinfo>-<partinfo>BBa_J107010</partinfo> + 1mM IPTG | 76,5 | 2,2
|
| <partinfo>pSB1A3</partinfo>-<partinfo>BBa_J04450</partinfo> | 107,8 | 0,3
|
| <partinfo>pSB1A3</partinfo>-<partinfo>BBa_J04450</partinfo> + 1mM IPTG | 101,7 | 4,8
|
These results demonstrate that cells growth is not significantly affected by the presence of IPTG, even at the high of 1 mM.
<partinfo>BBa_J107010</partinfo> and <partinfo>BBa_J04450</partinfo> were then tested in the low copy (~5 copies per cell) vector <partinfo>pSB4C5</partinfo> in order to test their inducibility. The results are shown here as the RPU values at the steady state (constant RFP sysnthesis rate per cell) at different IPTG concentrations.
 RPU of <partinfo>pSB4C5</partinfo>-<partinfo>BBa_J107010</partinfo> and <partinfo>pSB4C5</partinfo>-<partinfo>BBa_J04450</partinfo> as a function of IPTG concentration. The error bars represent the standard errors of three independent measurements. |
Results show that in this condition both <partinfo>BBa_R0010</partinfo> and <partinfo>BBa_R0011</partinfo> produce different amounts of RFP as a function of the IPTG concentration. The amplitude of the two curves show that the promoters are very strong when induced with IPTG >= 10 uM. Although the experiments were carried out in the same conditions, the variability between experiments was high, especially for <partinfo>BBa_R0010</partinfo> (mean coefficient of variaton of about 37% for <partinfo>BBa_R0010</partinfo> and 15% for <partinfo>BBa_R0011</partinfo>), while the RPU variability between three wells in the same experiment is much lower (mean coefficient of variaton of bout 3.5% for both promoters).
The above figure shows that <partinfo>BBa_R0011</partinfo> is stronger than the <partinfo>BBa_R0010</partinfo> wild type promoter in low copy plasmid. This result is unexpected because the same promoters in high copy vectors behaved differently (<partinfo>BBa_R0010</partinfo> was stronger than the <partinfo>BBa_R0011</partinfo>, see above).
In the uninduced state, <partinfo>BBa_R0011</partinfo> has about the same strength as the <partinfo>BBa_J23101</partinfo> reference standard promoter.
This static characteristic shows that the promoters are both leaky and a very low IPTG concentration (10 uM) is sufficient to trigger gene expression at *very* high levels.
These results demonstrate that the genomic lacI is partially able to repress the two promoters, but very low IPTG concentrations are sufficient to bind the repressor and trigger the promoters transcription.
Doubling times were also estimated for these cultures. Their values are reported below for uninduced and 1 mM IPTG-induced cultures.
| Cultures | Mean doubling times [minutes] | standard errors over 3 independent experiments [minutes]
|
| <partinfo>pSB4C5</partinfo>-<partinfo>BBa_J107010</partinfo> | 113,5 | 10,8
|
| <partinfo>pSB4C5</partinfo>-<partinfo>BBa_J107010</partinfo> + 1mM IPTG | 106,8 | 5,5
|
| <partinfo>pSB4C5</partinfo>-<partinfo>BBa_J04450</partinfo> | 85 | 5
|
| <partinfo>pSB4C5</partinfo>-<partinfo>BBa_J04450</partinfo> + 1mM IPTG | 90 | 4,5
|
As obtained for the cultures with high copy plasmids, the growth rate of TOP10 harbouring low copy vectors with the measurement parts is not affected by IPTG presence.
Dynamic characterization in low copy vector: The figure below shows a typical relative RFP synthesis rate per cell time series for <partinfo>BBa_J107010</partinfo> and <partinfo>BBa_J04450</partinfo> induced with 1 mM of IPTG and uninduced. These time series show that the full induction can be reached after about 50 min from the induction.
 Mean Scell signal as a function of time for <partinfo>pSB4C5</partinfo>-<partinfo>BBa_J107010</partinfo> and <partinfo>pSB4C5</partinfo>-<partinfo>BBa_J04450</partinfo>. Induced (with 1 mM of IPTG) and uninduced cultures are shown. Induction occurs at t=0. The shown graph is relative to one of the three experiments performed in different days. |
Conclusion: the characterization of two IPTG-inducible promoters has been performed and the performance of these two promoters have been compared in terms of transcriptional strength. The reported results are easily sharable in different laboratories thanks to the used standard RPU approach.
Methods:
- A of long term storage glycerol stock was streaked on a LB plate with suitable antibiotic. Tha plate was incubated overnight at 37°C.
- A single colony was inoculated in 1 ml of M9 + suitable antibiotic in a 15 ml tube and incubated at 37°C, 220 rpm for about 16 hours.
- The grown cultures were then diluted 1:100 in 2-5 ml of M9 supplemented medium and incubated in the same conditions as before for about 4-5 hours.
- For each desired IPTG concentration to be tested, three 200 ul aliquots of the cultures were aliquoted in a flat-bottom 96-well microplate, avoiding to perform dynamic experiments in the microplate frame (in order to prevent evaporation effects in the frame).
- 2 ul of properly diluted IPTG (Sigma Aldrich) were added to the three wells for each desired concentration.
- The microplate was incubated in the Tecan Infinite F200 microplate reader and fluorescence and absorbance were measured with this automatic protocol:
- 37°C constant for all the experiment;
- sampling time of 5 minutes;
- fluorescence gain of 50 or 80;
- O.D. filter at 600 nm;
- RFP filters at 535nm (ex) / 620nm (em);
- 15 seconds of linear shaking (3mm amplitude) followed by 10 seconds of waiting before the measurements in order to make a homogeneous culture.
- Experiment duration time: about 6 hours.
- This experiment was performed three times in different days.
Data analysis: Relative Promoter Units (RPUs) were estimated as described by [Kelly JR et al. (2009), J Biol Eng 3:4].
Briefly:
- Absorbance and fluorescence time series were normalized by subtracting the absorbance of the media and the fluorescence of a negative control (a non fluorescent TOP10 culture) respectively, thus yielding O.D.600 and RFP time series.
- RFP synthesis rate per cell (called Scell) was computed as (1/O.D.600)*dGFP/dt. (this signal is not actually the RFP synthesis rate, but is proportional to it).
- The RFP synthesis rate per cell was averaged at the steady state during the exponential growth phase (validated by identifying the linear region of the ln(O.D.600)).
- The RPU of the promoter of interest in a specific condition was computed as mean_Scell,phi/mean_Scell,J23101 where phi is the promoter of interest, J23101 is the reference standard and mean_Scell is the mean Scell signal value, computed as explained above.
<partinfo>BBa_K300009</partinfo>/<partinfo>BBa_I4102</partinfo> - PoPS->3OC6HSL sender device
<partinfo>BBa_K300009</partinfo> and <partinfo>BBa_K300010</partinfo> was assembled downstream of the promoters the table reported in, thus obtaining the following parts:
| BioBrick | Description
|
| <partinfo>BBa_K300030</partinfo> | 
J23118
|
| <partinfo>BBa_K300028</partinfo> | 
J23110
|
| <partinfo>BBa_K300029</partinfo> | 
J23116
|
| <partinfo>BBa_K300025</partinfo> | 
J23101
|
| <partinfo>BBa_K300026</partinfo> | 
J23105
|
| <partinfo>BBa_K300027</partinfo> | 
J23106
|
For each part, a measurement system was built, exploiting the production of the reporter gene GFP (Green Fluorescent Protein) by <partinfo>BBa_F2620</partinfo> receiver device, to evaluate the "switch on" condition of every self-inducible promoter. Many different combinations were explored, in order to provide a library of promoters able to initiate transcription at the desired culture density.
Quantification of the HSL produced by autoinducer generators
Experimental implementation: The autoinducer generators <partinfo>BBa_K300030</partinfo>, <partinfo>BBa_K300028</partinfo>, <partinfo>BBa_K300029</partinfo>, <partinfo>BBa_K300025</partinfo>, <partinfo>BBa_K300026</partinfo> and <partinfo>BBa_K300027</partinfo> were, thus, characterized by measuring the concentration of HSL released in the medium of cultures grown for 6 hours. All the details are available in this section.
<partinfo>BBa_T9002</partinfo> contained in <partinfo>pSB1A3</partinfo> in E. coli TOP10 was used as a HSL->GFP biosensor. In every experiment, a HSL-GFP calibration curve with known concentration of HSL was produced.
Results: The amount of 3OC6-HSL produced after a 6 hours growth by E. coli DH5alpha bearing the parts in high copy plasmid <partinfo>pSB1A2</partinfo> is reported in Fig.8 and in the table below:
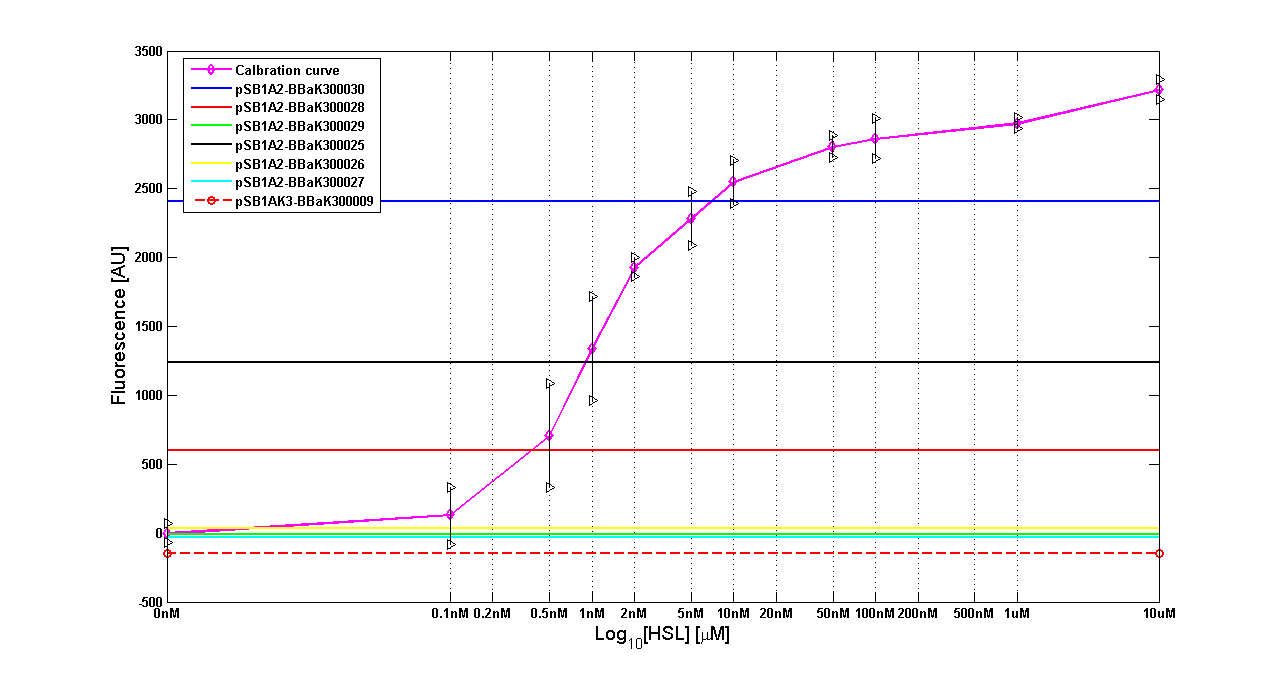 Figure 8 - <partinfo>BBa_T9002</partinfo> calibration curve for detection of [HSL] produced by autoinducer generators in high copy vector. |
| BioBrick | Wiki name | E. coli strain | [HSL]
|
| <partinfo>BBa_K300030</partinfo> | I14 | DH5alpha | 0.7 uM
|
| <partinfo>BBa_K300028</partinfo> | I15 | DH5alpha | 0.04 uM
|
| <partinfo>BBa_K300029</partinfo> | I16 | DH5alpha | not detected
|
| <partinfo>BBa_K300025</partinfo> | I17 | DH5alpha | 0.09 uM
|
| <partinfo>BBa_K300026</partinfo> | I18 | DH5alpha | not detected
|
| <partinfo>BBa_K300027</partinfo> | I19 | DH5alpha | 0.002 uM
|
The amount of 3OC6-HSL produced by the parts contained in low copy plasmid <partinfo>pSB4C5</partinfo> after a 6 hour cell growth is reported in figure and in the table below:
 Figure 9 - <partinfo>BBa_T9002</partinfo> calibration curve for detection of [HSL] produced by the autoinducer generators in low copy vector. |
| BioBrick | Wiki name | E. coli strain | [HSL]
|
| <partinfo>BBa_K300030</partinfo> | I14 | DH5alpha | 0.005 uM
|
| <partinfo>BBa_K300028</partinfo> | I15 | DH5alpha | 0.002 uM
|
| <partinfo>BBa_K300029</partinfo> | I16 | DH5alpha | not detected
|
| <partinfo>BBa_K300025</partinfo> | I17 | DH5alpha | 0.003 uM
|
| <partinfo>BBa_K300026</partinfo> | I18 | DH5alpha | not detected
|
| <partinfo>BBa_K300027</partinfo> | I19 | DH5alpha | not detected
|
Discussion These experiments provided extremely useful informations about the capability of the signal generators to produce the 3OC6-HSL signal molecule. Data are quantitative, but incomplete because for weak promoters or medium-strength promoters contained in a low copy number plasmid the amount of 3OC6-HSL was not detectable using this system. However, this simple experiment shows that there is a strong correlation between the strength of promoter and the amount of signal molecule produced. These results confirm that the production of the autoinducer can be engineered in E. coli and different expression systems reach different amounts of 3OC6-HSL in the growth media as a function of the promoter strength. Thus, these results demonstrate that self-inducible circuits can be rationally designed from a set of well characterized standard parts.
Modulation of plasmid copy number
The signal generator was assembled on a low copy number plasmid (<partinfo>pSB4C5</partinfo>) and the receiver device on high copy number plasmid (<partinfo>pSB1A2</partinfo>).
The circuits we obtained and tested are summarized in tables.
Sender/Receiver devices assembled as a unique BioBrick part on the same vector
Sender devices assembled on low copy number vector and Receiver device on high copy number vector
BioBrick
Sender | Description | Sender Vector | <partinfo>BBa_F2620</partinfo>
Receiver vector
|
| <partinfo>BBa_K300030</partinfo>
| 
J23118
| <partinfo>pSB4C5</partinfo>
LC
| <partinfo>pSB1A2</partinfo>
HC
|
| <partinfo>BBa_K300028</partinfo>
| 
J23110
| <partinfo>pSB4C5</partinfo>
LC
| <partinfo>pSB1A2</partinfo>
HC
|
| <partinfo>BBa_K300029</partinfo>
| 
J23116
| <partinfo>pSB4C5</partinfo>
LC
| <partinfo>pSB1A2</partinfo>
HC
|
| <partinfo>BBa_K300025</partinfo>
| 
J23101
| <partinfo>pSB4C5</partinfo>
LC
| <partinfo>pSB1A2</partinfo>
HC
|
| <partinfo>BBa_K300026</partinfo>
| 
J23105
| <partinfo>pSB4C5</partinfo>
LC
| <partinfo>pSB1A2</partinfo>
HC
|
| <partinfo>BBa_K300027</partinfo>
| 
J23106
| <partinfo>pSB4C5</partinfo>
LC
| <partinfo>pSB1A2</partinfo>
HC
|
Results
The following measurement systems were realized assembling GFP downstream of the receiver circuit. The parts characterized are reported in this table:
| Sender device
| Sensor systems with GFP
| Measurement Device
|
<partinfo>BBa_K300030</partinfo> in <partinfo>pSB4C5</partinfo>

J23118
| <partinfo>BBa_T9002</partinfo> in <partinfo>pSB1A3</partinfo>

| Sender and Receiver are contained
in two different plasmids,
cotransformed in the same cell
|
<partinfo>BBa_K300028</partinfo> in <partinfo>pSB4C5</partinfo>

J23110
| <partinfo>BBa_T9002</partinfo> in <partinfo>pSB1A3</partinfo>

| Sender and Receiver are contained
in two different plasmids,
cotransformed in the same cell
|
<partinfo>BBa_K300029</partinfo> in <partinfo>pSB4C5</partinfo>

J23116
| <partinfo>BBa_T9002</partinfo> in <partinfo>pSB1A3</partinfo>

| Sender and Receiver are contained
in two different plasmids,
cotransformed in the same cell
|
<partinfo>BBa_K300026</partinfo> in <partinfo>pSB4C5</partinfo>

J23105
| <partinfo>BBa_T9002</partinfo> in <partinfo>pSB1A3</partinfo>

| Sender and Receiver are contained
in two different plasmids,
cotransformed in the same cell
|
<partinfo>BBa_K300025</partinfo> in <partinfo>pSB4C5</partinfo>

J23101
| <partinfo>BBa_T9002</partinfo> in <partinfo>pSB1A3</partinfo>

| Sender and Receiver are contained
in two different plasmids,
cotransformed in the same cell
|
<partinfo>BBa_K300027</partinfo> in <partinfo>pSB4C5</partinfo>

J23106
| <partinfo>BBa_T9002</partinfo> in <partinfo>pSB1A3</partinfo>

| Sender and Receiver are contained
in two different plasmids,
cotransformed in the same cell
|
Cultures of E. coli TOP10 bearing the plasmids containing the self-inducible devices expressing GFP were grown according to this protocol and all data collected were analyzed as explained in this section. An example of O.D.600 and fluorescence signals for a self-inducible device expressing GFP (<partinfo>BBa_K300026</partinfo>), as well as its Scell signal and the estimated threshold value, is reported below.
 Growth curve of <partinfo>BBa_K300019</partinfo> (O.D.600) | 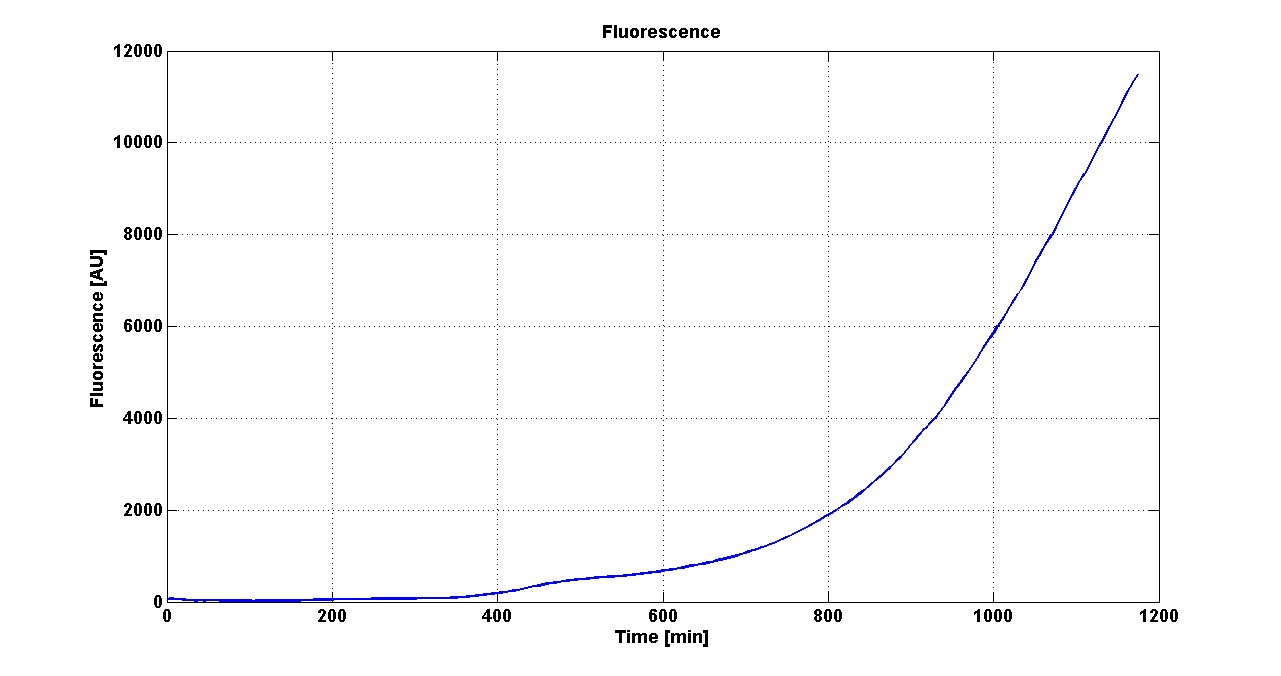 Fluorescence curve of <partinfo>BBa_K300019</partinfo> (G.F.P.) |
 Fluorescence VS Optical density curve of <partinfo>BBa_K300019</partinfo> | 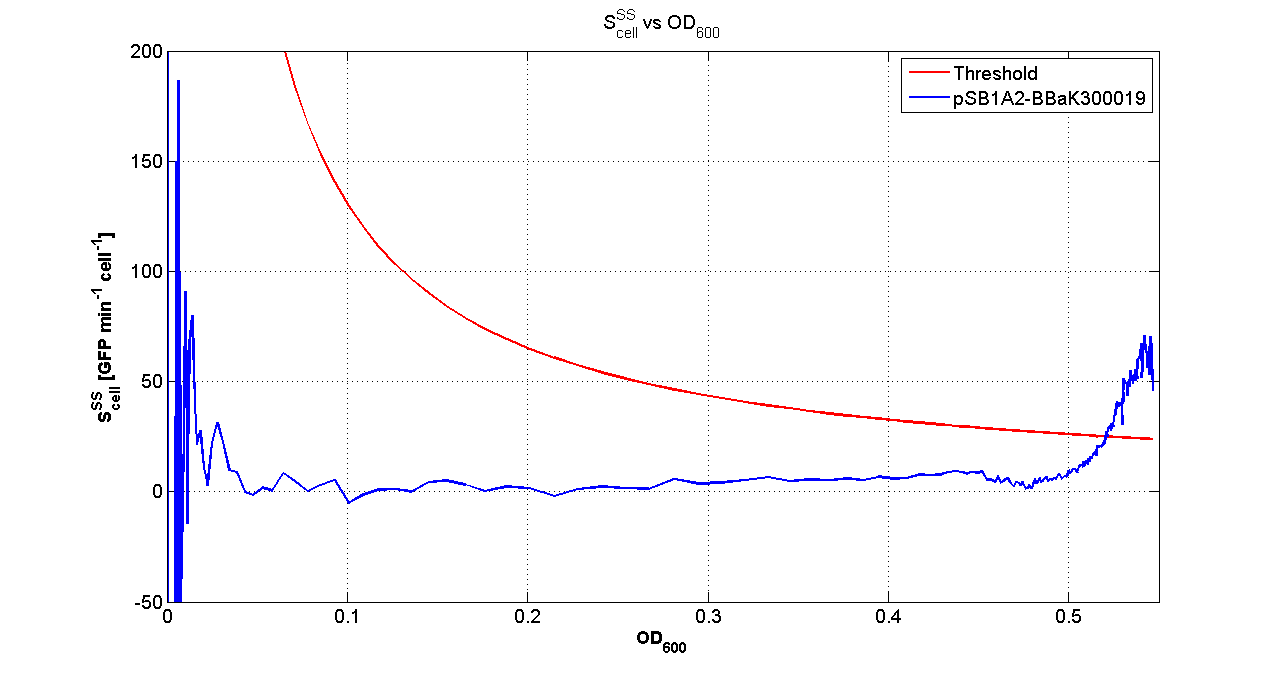 Scell=(dGFP/dt)/O.D.600 and threshold |
For every self-inducible device, several parameters were evaluated:
- O.D.start is the O.D.600 corresponding to the transcription initiation of the gene of interest; it was evaluated as reported in this section;
- K_HSL is the HSL synthesis rate per cell; it was estimated with the algorithm described here
- Doubling time is the period of time required for a cell population to double; it was evaluated as described in Doubling time evaluation section
- Scell_ratio was evaluated as (Scell_max_Phi)/(Scell_max_J101). Phi is the self-inducible device of ineterst, J101 is the reference standard <partinfo>BBa_J23101</partinfo> contained in the same vector of the receiver device. Scell_max_phi was evaluated for times subsequent to the transcription initiation.
Results are summarized in the following tables:
Tab. 1 - Sender on low copy plasmid <partinfo>pSB4C5</partinfo> and Receiver on high copy plasmid <partinfo>pSB1A3</partinfo>
Self-inducible device
working
not working
| LB
| M9
|
| O.D.start
| K_HSL
[nmol/min]
| Doubling time
[min]
| Scell ratio
| O.D.start
| K_HSL
[nmol/min]
| Doubling time
[min]
| Scell ratio
|
<partinfo>BBa_K300030</partinfo>
(wiki name: I14)
in <partinfo>pSB4C5</partinfo> plasmid
| <partinfo>BBa_T9002</partinfo> in <partinfo>pSB1A3</partinfo> |

LC |

HC |
| Constitutive
| 2.92 10^-16
±
8.16 10^-18
| 33.20
±
1.46
| 1.20
±
0.20
| 0.05
±
0.005
| 8.06 10^-16
±
1.28 10^-16
| 58.27
±
5.66
| 0.91
±
0.15
|
<partinfo>BBa_K300028</partinfo>
(wiki name: I15)
in <partinfo>pSB4C5</partinfo> plasmid
| <partinfo>BBa_T9002</partinfo> in <partinfo>pSB1A3</partinfo> |

LC |

HC |
| 0.32
±
0.04 **
| 8.31 10^-17
±
3.92 10^-17 **
| 33.24
±
1.27
| 0.61
±
0.04 **
| 0.15
±
0.007
| 1.72 10^-16
±
6.65 10^-18
| 65.57
±
5.99
| 0.26
±
0.03
|
| <partinfo>BBa_K300029</partinfo> (wiki name: I16) in <partinfo>pSB4C5</partinfo> plasmid
| <partinfo>BBa_T9002</partinfo> in <partinfo>pSB1A3</partinfo> |

LC |

HC |
| 0.31
*
| 1.17 10^-16
*
| 35.46
±
2.85
| 0.57
*
| X
| X
| X
| X
|
<partinfo>BBa_K300025</partinfo>
(wiki name: I17)
in <partinfo>pSB4C5</partinfo> plasmid
| <partinfo>BBa_T9002</partinfo> in <partinfo>pSB1A3</partinfo> |

LC |

HC |
| Constitutive
| 2.85 10^-16
±
1.90 10^-17
| 33.27
±
2.85
| 1.09
±
0.28
| 0.1
±
0.01
| 3.81 10^-16
±
4.68 10^-17
| 59.02
±
8.28
| 0.45
±
0.08
|
<partinfo>BBa_K300026</partinfo>
(wiki name: I18)
in <partinfo>pSB4C5</partinfo> plasmid
| <partinfo>BBa_T9002</partinfo> in <partinfo>pSB1A3</partinfo> |

LC |

HC |
| X
| X
| 34.63
±
1.31
| X
| 0.53
±
0.03 **
| 1.78 10^-17
±
1.36 10^-18 **
| 61.68
±
7.08
| 0.03
±
0.002 **
|
<partinfo>BBa_K300027</partinfo>
(wiki name: I19)
in <partinfo>pSB4C5</partinfo> plasmid
| <partinfo>BBa_T9002</partinfo> in <partinfo>pSB1A3</partinfo> |

LC |

HC |
| X
| X
| 33.80
±
1.78
| X
| 0.33
±
0.05
| 5.46 10^-17
±
7.86 10^-18
| 52.84
±
4.29
| 0.06
±
0.002
|
Constitutive: the induction point, in term of O.D.600, is under the minimum detectable value calculated by the algorithm. This minimum value was estimated by running the algorithm on data acquired from a culture that constitutively produces GFP. For this reason, the devices labelled as constitutive can be considered as constitutive GFP producers.
*: in two of three experiments the self-induction failed, thus having a non-induced culture for all the cell densities. The standard errors were not computed for these cultures.
**: in one of three experiments the self-induction failed, thus having a non-induced culture for all the cell densities. The standard errors were computed on two independent experiments.
<partinfo>BBa_K300016</partinfo> is labelled with *, but probably induction failed in two of the three experiments because the culture didn't reach the O.D.start point (the experiment was stopped before the culture reached the O.D.600 critical value).
Discussion: two modular PoPS-based devices (<partinfo>BBa_K300010</partinfo> and <partinfo>BBa_K300009</partinfo>/<partinfo>BBa_F2620</partinfo>) were designed and used to realize a library of self-inducible devices, able to start the production of the heterologous protein at a defined culture density. They were characterized in many different experimental conditions:
- varying the strength of the promoter controlling the production of the signal molecule (Sender Modulation)
- varying the copy number of vectors bearing both Sender and Receiver circuits
- varying the growth medium (LB or M9)
A graphical summary is reported in the figures below:
 Typical E. coli growth curve with O.D.start evaluated by Threshold algorithm in LB |
 Typical E. coli growth curve with O.D.start evaluated by Threshold algorithm in M9 |
A model-based approach was proposed to estimate many interesting parameters, such as the HSL synthesis rate per cell, and an algorithm was proposed in order to evaluate the O.D.start for every self-inducible device.
In the figures below, the O.D.start and the HSL synthesis rate as a function of the strength of the promoter (RPU) controlling the signal molecule production are reported for <partinfo>BBa_K300010</partinfo> (Sender&Receiver device in HC plasmid) and for <partinfo>BBa_K300009</partinfo>/<partinfo>BBa_F2620</partinfo> (Sender device in LC plasmid in combination with Receiver device in HC plasmid).
 O.D.start and K_HSL as a function of RPUs of the promoters controlling the signal molecule production for <partinfo>BBa_K300010</partinfo> in high copy number plasmid in M9 medium |
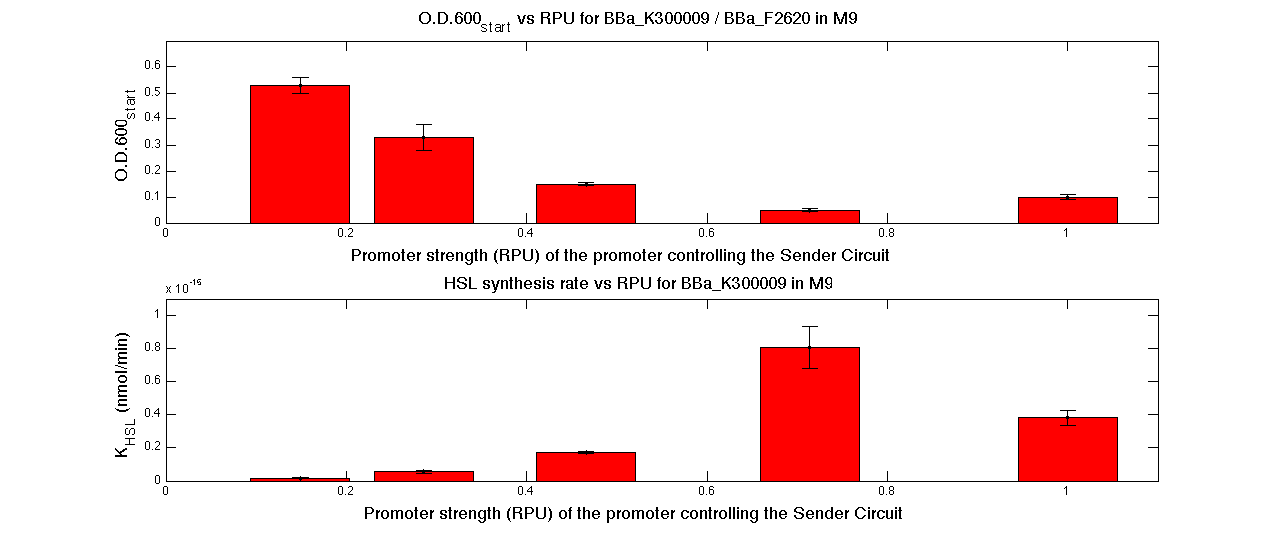 O.D.start and K_HSL as a function of RPUs of the promoters controlling the autoinducer production for <partinfo>BBa_K300010</partinfo> in low copy number plasmid used in combination with <partinfo>BBa_F2620</partinfo> in high copy plasmid in M9 medium |
A strong correlation between the promoter strength, previously measured in RPU, and the O.D.start is depicted by the reported graphs. This is consistent with the expected behaviour of these parts, since the HSL synthesis rate is an increasing function of the upstream promoter's strength.
For RPU values greater or equal to 1, the expected behaviour is not confirmed anymore. This is probably because too high luxI expression levels and/or synthesis rate of HSL are injurious for the cell.
The combination of promoter strength variation and plasmid copy number modulation allows the creation of a library of self-inducible devices able to perform autoinduction at many different O.D.600 values, in any cellular growth phase.
<partinfo>BBa_F2620</partinfo> - 3OC6HSL -> PoPS Receiver
The measurement system of this part (<partinfo>BBa_T9002</partinfo>) was successfully used as a biosensor to estimate the concentration of HSL present in the growth media of cultures expressing luxI (<partinfo>BBa_C0061</partinfo>).
Additional information and details are available in [http://partsregistry.org/Part:BBa_K300009:Experience BBa_K300009 Experience page].
 <partinfo>BBa_T9002</partinfo> calibration curve for detection of [HSL] produced by autoinducer generators in high copy vector. |
 <partinfo>BBa_T9002</partinfo> calibration curve for detection of [HSL] produced by the autoinducer generators in low copy vector. |
<partinfo>BBa_J61001</partinfo> - R6K Origin of replication
<partinfo>BBa_K300008</partinfo> was used as a validation construct for this conditional replication origin, in order to test its capability to be propagated in pir+ or pir-116 strain and its inability to propagate in the other E. coli strains.
In particular, <partinfo>BBa_K300008</partinfo> was cut with XbaI-SpeI and the insert was isolated and purified from a 1% agarose gel. Then, it was self-ligated to generate a Cm-resistant R6K plasmid).
BW25141 (<partinfo>BBa_K300984</partinfo>) and BW23474 (<partinfo>BBa_K300985</partinfo>) were chosen as pir+ and pir-116 strains respectively, while DH5alpha (<partinfo>BBa_V1001</partinfo>), MC1061 (<partinfo>BBa_K300078</partinfo>) and MG1655 (<partinfo>BBa_V1000</partinfo>) were chosen as pir- strains.
All these strains were made competent following the commonly used CaCl2 method [Sambrook J, Fritsch EF, and Maniatis T (1989), Molecular cloning: a laboratory manual, 2nd ed. Cold Spring Harbor Laboratory Press, Cold Spring Harbor, N.Y.]. Then, a vial of 100 ul of competent cells was transformed with 2-4 ng of:
- no DNA (negative control);
- a pSB*** series vector (positive control);
- self-ligated <partinfo>BBa_K300008</partinfo>.
and plated on LB+Cm at 34 ug/ml for high-copy plasmids, Cm at 12.5 ug/ml for medium/low copy plasmids and for the negative control strains transformed with the R6K plasmids.
The colonies were counted in each plate and the transformation efficiency was estimated in [CFU/ug of DNA] as:
efficiency [CFU/ug of DNA]= # CFU * 1000 ng of DNA / amount of transformed DNA [ng]
The results are shown here:
| Strain
| Efficiency with no DNA
| Efficiency with pSB*** (positive control)
| Efficiency with the self-ligated <partinfo>BBa_K300008</partinfo> (R6K plasmid)
|
| <partinfo>BBa_K300084</partinfo>
| 0
| 10^5
| 10^5
|
| <partinfo>BBa_K300085</partinfo>
| 0
| 10^6
| 10^6
|
| <partinfo>BBa_V1001</partinfo>
| 0
| 10^8
| 0
|
| <partinfo>BBa_K300078</partinfo>
| 0
| 10^6
| 0
|
| <partinfo>BBa_V1000</partinfo>
| 0
| 10^5
| 0
|
These results show that <partinfo>BBa_J61001</partinfo> replication origin can be only propagated in pir+ and pir-116 strains (<partinfo>BBa_K300084</partinfo> and <partinfo>BBa_K300085</partinfo>), while the transformation of other strains with the R6K plasmid yielded no colonies after transformation.
Moreover, these results show that the R6K plasmid in pir+ and pir-116 strains was transformed with the same efficiency as the pSB*** positive control plasmid, demonstrating that the R6K origin doesn't give any handicap in plasmid transformation.
<partinfo>BBa_J23100</partinfo>, <partinfo>BBa_J23101</partinfo>, <partinfo>BBa_J23105</partinfo>, <partinfo>BBa_J23106</partinfo>, <partinfo>BBa_J23110</partinfo>, <partinfo>BBa_J23114</partinfo>, <partinfo>BBa_J23116</partinfo>, <partinfo>BBa_J23118</partinfo> - constitutive promoters from Anderson's collection
The <partinfo>BBa_J23100</partinfo>, <partinfo>BBa_J23101</partinfo>, <partinfo>BBa_J23105</partinfo>, <partinfo>BBa_J23106</partinfo>, <partinfo>BBa_J23110</partinfo>, <partinfo>BBa_J23114</partinfo>, <partinfo>BBa_J23116</partinfo>, <partinfo>BBa_J23118</partinfo> were charcterized in LB and M9 supplemented with glycerol (0.4%) growth media in high copy and low copy vectors in E. coli TOP10 (<partinfo>BBa_V1009</partinfo>).
RPU and doubling time were characterized for all of them, according to the protocols reported in this section.
The following measurement systems were used for high copy plasmids:
- <partinfo>BBa_J61002</partinfo>-<partinfo>BBa_J23100</partinfo>
- <partinfo>BBa_J61002</partinfo>-<partinfo>BBa_J23101</partinfo>
- <partinfo>BBa_J61002</partinfo>-<partinfo>BBa_J23105</partinfo>
- <partinfo>BBa_J61002</partinfo>-<partinfo>BBa_J23106</partinfo>
- <partinfo>BBa_J61002</partinfo>-<partinfo>BBa_J23110</partinfo>
- <partinfo>BBa_J61002</partinfo>-<partinfo>BBa_J23114</partinfo>
- <partinfo>BBa_J61002</partinfo>-<partinfo>BBa_J23116</partinfo>
- <partinfo>BBa_J61002</partinfo>-<partinfo>BBa_J23118</partinfo>
In order to build low copy plasmid measurement systems, the EcoRI-PstI fragment (J231xx-RFP) of each <partinfo>BBa_J61002</partinfo>-BBa_J231xx was assembled into <partinfo>pSB4C5</partinfo> vector. This fragment contains the constitutive promoter of interest upstream a RBS-RFP-TT expression system.
The following measurement parts were used for low copy plasmids:
- <partinfo>pSB4C5</partinfo>-<partinfo>BBa_J23100</partinfo>
- <partinfo>pSB4C5</partinfo>-<partinfo>BBa_J23101</partinfo>
- <partinfo>pSB4C5</partinfo>-<partinfo>BBa_J23105</partinfo>
- <partinfo>pSB4C5</partinfo>-<partinfo>BBa_J23106</partinfo>
- <partinfo>pSB4C5</partinfo>-<partinfo>BBa_J23110</partinfo>
- <partinfo>pSB4C5</partinfo>-<partinfo>BBa_J23114</partinfo>
- <partinfo>pSB4C5</partinfo>-<partinfo>BBa_J23116</partinfo>
- <partinfo>pSB4C5</partinfo>-<partinfo>BBa_J23118</partinfo>
The RPU values and doubling times are here reported:
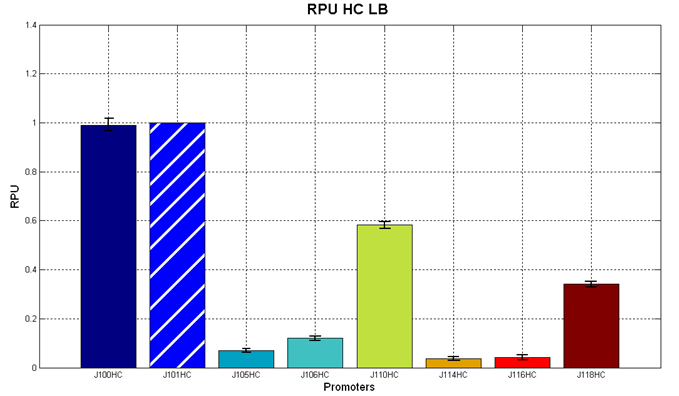 Figure 5 - R.P.U. of the studied promoters from Anderson promoters' collection, LB medium and high copy plasmid (<partinfo>BBa_J61002</partinfo>) | 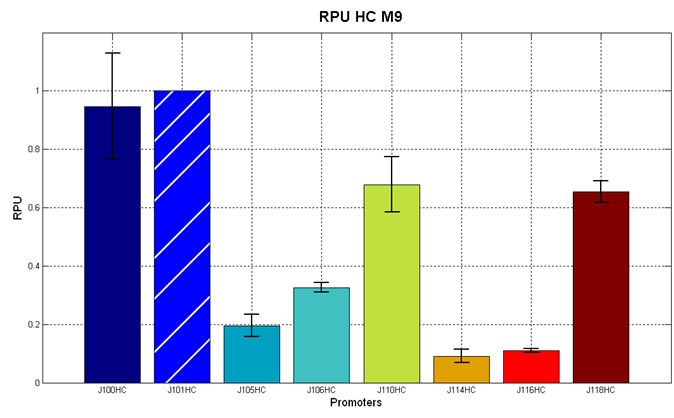 Figure 6 - R.P.U. of the studied promoters from Anderson promoters' collection, M9 medium and high copy plasmid (<partinfo>BBa_J61002</partinfo>) |
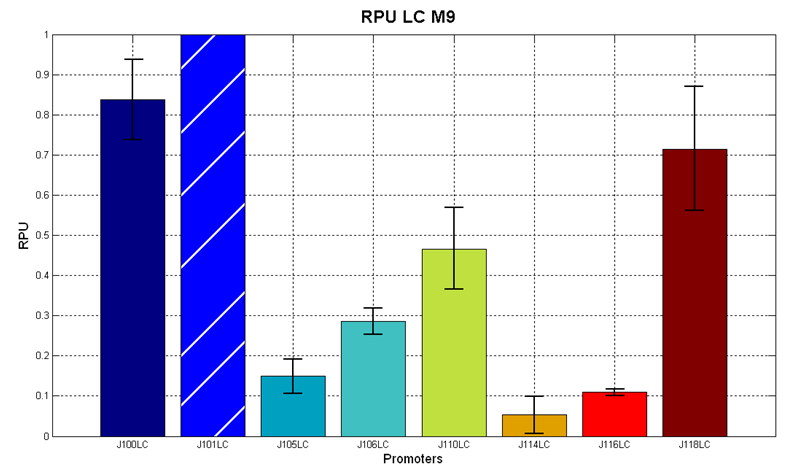 Figure 7 - R.P.U. of the studied promoters from Anderson promoters' collection, M9 medium and low copy plasmid (<partinfo>pSB4C5</partinfo>). These plasmids were constructed by assembling the EcoRI-PstI fragment of <partinfo>BBa_J61002</partinfo>-BBa_J231xx in <partinfo>pSB4C5</partinfo> vector, in order to transfer the promoter and the RBS-RFP-TT expression construct from <partinfo>BBa_J61002</partinfo> to <partinfo>pSB4C5</partinfo>. |
The error bars represent the standard deviation for three dfferent wells in the same experiment.
Doubling times were evaluated for the described cultures (HC stands for High Copy and LC stands for Low Copy):
| Promoter
| doubling time [minutes]
|
| LB in HC plasmid | M9 in HC plasmid | M9 in LC plasmid
|
| <partinfo>BBa_J23100</partinfo> | 33.75
±
1.34 | 82.53
±
2.45 | 86.11
±
4.45
|
| <partinfo>BBa_J23101</partinfo> | 35.93
±
0.62 | 82.68
±
1.84 | 86.42
±
1.91
|
| <partinfo>BBa_J23105</partinfo> | 29.86
±
0.33 | 63.09
±
7.08 | 85.00
±
5.13
|
| <partinfo>BBa_J23106</partinfo> | 29.17
±
0.96 | 68.11
±
4.25 | 88.71
±
0.90
|
| <partinfo>BBa_J23110</partinfo> | 31.28
±
0.42 | 67.52
±
5.87 | 76.15
±
2.16
|
| <partinfo>BBa_J23114</partinfo> | 28.97
±
0.49 | 59.44
±
5.20 | 80.12
±
0.95
|
| <partinfo>BBa_J23116</partinfo> | 28.14
±
0.25 | 72.74
±
0.37 | 81.68
±
3.08
|
| <partinfo>BBa_J23118</partinfo> | 32.84
±
0.31 | 73.64
±
2.41 | 89.86
±
2.93
|
It was not possible to evaluate promoters activities in low copy number plasmids in LB because the RFP activity was too weak and not distinguishable from the background.
Discussion: we observed that the ranking previously documented in the Registry is not valid in all the tested conditions, even if a general agreement can be observed. As an example, <partinfo>BBa_J23110</partinfo> in high copy plasmid is stronger than <partinfo>BBa_J23118</partinfo>, in contrast with the ranking reported in the Registry.
<partinfo>BBa_P1004</partinfo> - chloramphenicol resistance cassette
<partinfo>BBa_P1004</partinfo> has been successfully used in the assembly of <partinfo>BBa_K300000</partinfo> integrative base vector for E. coli. All the intermediate parts which contained <partinfo>BBa_P1004</partinfo> showed Chloramphenicol resistance (tested up to 34 ug/ml in LB media) when transformed in TOP10 (<partinfo>BBa_V1009</partinfo>), DH5alpha (<partinfo>BBa_V1001</partinfo>), MC1061 (<partinfo>BBa_K300078</partinfo>), MG1655 (<partinfo>BBa_V1000</partinfo>), BW23474 (<partinfo>BBa_K300985</partinfo>) and DB3.1 (<partinfo>BBa_V1005</partinfo>) strains in a high-copy plasmid.
<partinfo>BBa_K125500</partinfo> - GFP fusion brick
This part can be useful to construct fluorescent fusion proteins. It is composed by a tail domain (the GFP <partinfo>K125500</partinfo>) with a transcriptional terminator (<partinfo>BBa_B0015</partinfo>) downstream.
Other protein domains can be fused upstream of this part in order to create chimeric fluorescent proteins, or it can be ligated to tags useful for low-cost protein purification.
This part was used do design the following BioBrick measurement systems:
- <partinfo>BBa_K300086</partinfo>
- <partinfo>BBa_K300088</partinfo>
- <partinfo>BBa_K300090</partinfo>
- <partinfo>BBa_K300091</partinfo>
- <partinfo>BBa_K300092</partinfo>
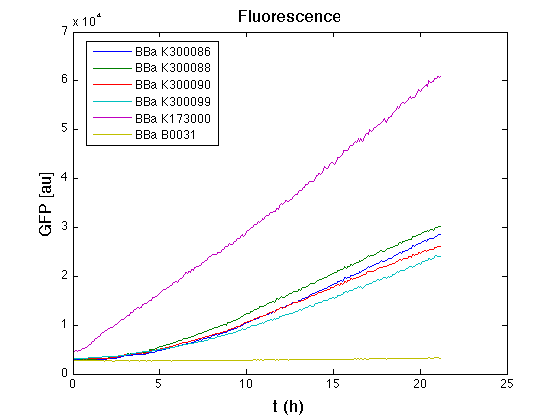
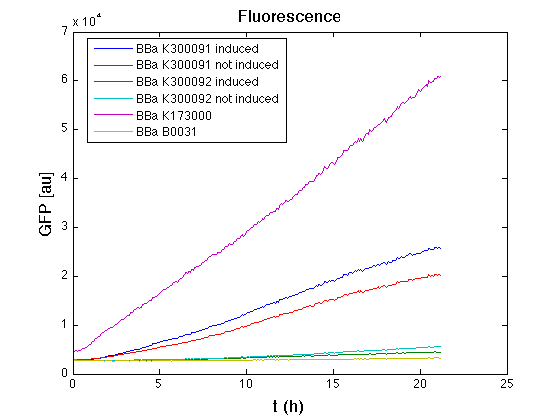
- <partinfo>BBa_K300099</partinfo>
to test these contructs:
- <partinfo>BBa_K300002</partinfo>
- <partinfo>BBa_K300093</partinfo>
- <partinfo>BBa_K300094</partinfo>
- <partinfo>BBa_K300095</partinfo>
- <partinfo>BBa_K300084</partinfo>
- <partinfo>BBa_K300097</partinfo>
respectively. All of the tested parts are synthetic fusion tags whose activity could be measured by assembling a promoter with RBS upstream and a tail domain with terminator downstream, thus yielding the measurement systems. <partinfo>BBa_K300005</partinfo> was used as a tail domain with terminator downstream. It has been assembled to test the correct folding of the resulting fusion protein by measuring the GFP and to test the affinity tag performance with a proof of concept protein.
In all of the measurement parts, GFP could be successfully detected in bacteria harbouring the measurement parts in high copy plasmids. In this condition, GFP was detected by using an excitation filter at 485nm and an emission filter at 540nm in a Infinite F200 microplate reader (Tecan).
|
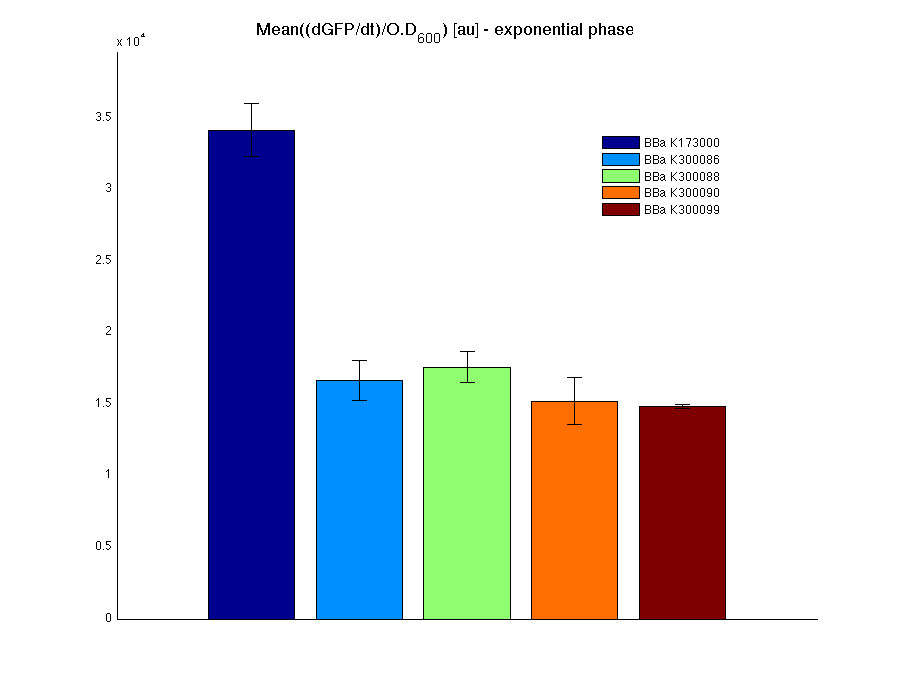 Mean (dGFP/dt)/O.D. over the exponential phase (under the hypothesis that GFP half-life in fusion contructs is similar to the original one - <partinfo>BBa_E0040</partinfo>) |
|
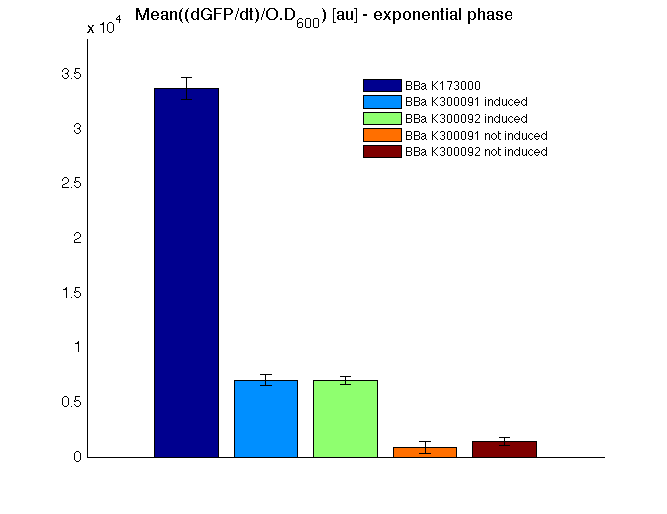 Mean (dGFP/dt)/O.D. over the exponential phase (under the hypothesis that GFP half-life in fusion contructs is similar to the original one - <partinfo>BBa_E0040</partinfo>) |
<partinfo>BBa_J72008</partinfo> - phi80 integration helper plasmid pInt80-649
<partinfo>BBa_J72008</partinfo> has been successfully used in the integration protocol of both MC1061 (<partinfo>BBa_K300078</partinfo>) and MG1655 (<partinfo>BBa_V1000</partinfo>) E. coli strains. See [http://partsregistry.org/Part:BBa_K300000:Experience BBa_K300000 Experience page] for details about how this plasmid was used.
It can be actually cured at 37-42°C, while it can be propagated at 30°C.
It actually enables the propagation of R6K (conditional replication origin) plasmids, thanks to its pir-116 gene.
|  "
"


