Team:NYMU-Taipei/Experiments/Speedy switch
From 2010.igem.org
(→Reporting Assay) |
(→Reporting Assay1) |
||
| Line 31: | Line 31: | ||
* Normalized the 12 different Theophylline concentration samples with NT & N. | * Normalized the 12 different Theophylline concentration samples with NT & N. | ||
[[Image:Plot20101023.png|800px]][fig.2] | [[Image:Plot20101023.png|800px]][fig.2] | ||
| + | *Discussion | ||
| + | Under 4mM theophylline , we added more concentrations of theophylline the protein expressed stronger ,so we can see the higher fluorescent intensity . From the paper said if added more than 5mM theophylline the Escherichia coli would die. | ||
==Reporting Assay2== | ==Reporting Assay2== | ||
Revision as of 18:13, 27 October 2010
| Home | Project Overview | Speedy reporter | Speedy switch | Speedy protein degrader | Experiments and Parts | Applications | F.A.Q | About Us |
Contents |
Method
- Protocol:
1.Selected genes to be reported are incubated overnight in an LB liquid culture at 37oC and 180-200rpm. This makes sure they are fresh in the morning. Positive and negative controls are also needed.
2.Overnight liquid culture is diluted to OD600 of 0.1, Theophylline is added at concentrations ranging from 0.01mM to 20mM, and the mix incubated for 2-2.5 hours.
3.Measurement of OD at 2 hours: For each used well in the 96-well plate: Take 200uL from the liquid (make sure you pipette this step well) and put it in a cuvette to read the OD600. Note down the OD600 ["OD at 2 hours"], then take the liquid in the cuvette and put it in the right place in the 96-well plate.
4.Measurement of fluorescence: Continuous measurement of fluorescence with the excitation/emission wavelengths 488/511nm for 2 hours, with one fluorescence data point every 2 minutes.
5.Measurement of OD at 4 hours: For each used well in the 96-well plate: Take the liquid from the well and put it in the cuvette to measure the OD ["OD at 4 hours"].
Reporting Assay
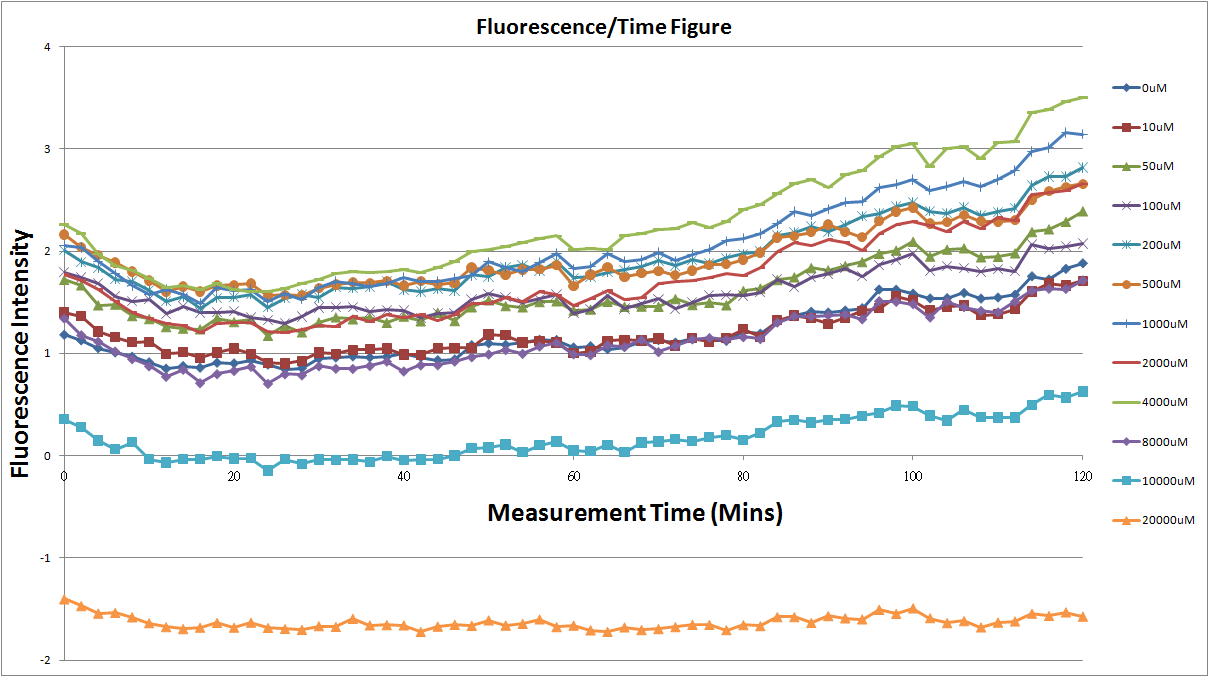
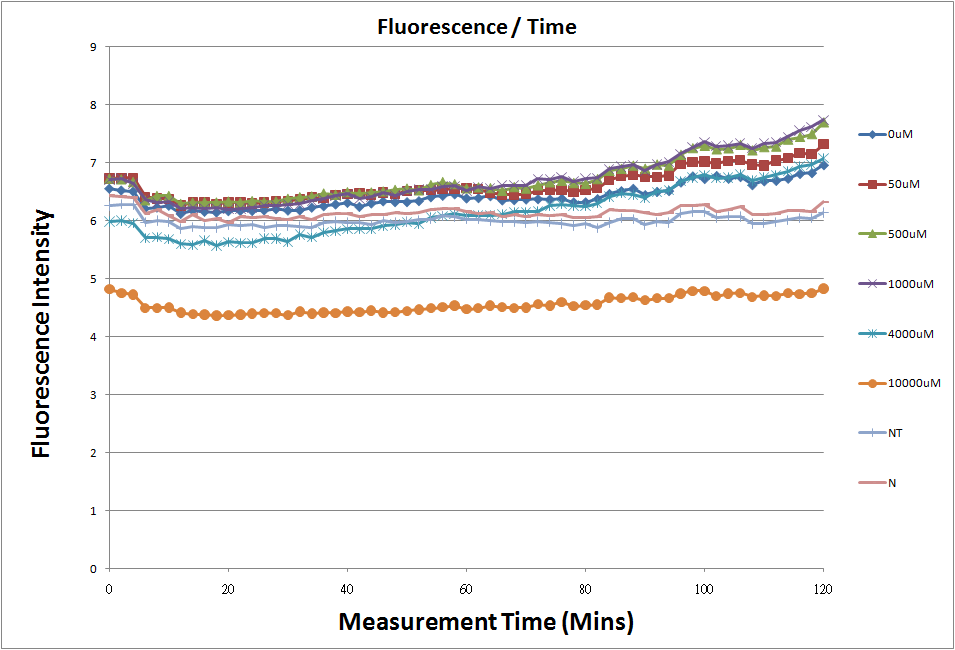
- Fig.1, fig.3, fig.5, and fig.7 are the original charts of the experiment. N line and NT line are control line. N line stands for the cell which sequence doesn't have pLac promoter.NT line stands for the cell which sequence doesn't have promoter but added 0.1mM Theophylline. N line shows that even though the sequence doesn't have promoter it still have little fluorescence so we use it to modify the instrument errors. 0μM sample which sequence has promoter but doesn’t added Theophylline still has little fluorescence because mRNA is leak. Normalizing with the N, we use this line to find out what's the degree of mRNA leak. NT line which doesn’t have promoter in the plasmid but add 0.1 mM Theophylline still is detected fluorescence. We added Theophylline in DMSO, so we use this NT line to normalize the other samples which added different concentration of Theophylline in order to eliminate the spectrum effect of Theophylline.
- Fig.2, fig.4, fig.6, and fig.8 are charts which have been normalized with the control N line and NT line.
Reporting Assay1
- The oringinal fluorescence data.
- Normalized the 12 different Theophylline concentration samples with NT & N.
- Discussion
Under 4mM theophylline , we added more concentrations of theophylline the protein expressed stronger ,so we can see the higher fluorescent intensity . From the paper said if added more than 5mM theophylline the Escherichia coli would die.
Reporting Assay2
- The original fluorescence data.
- Normalized 12 different concentration of Theophylline with NT & N.
Reporting Assay3
- The oringinal fluorescence data.
- Normalized the 6 different Theophylline concentration samples with NT & N.
Repoting Assay4
- [Reagent Formula]
- The original fluorescence data.
- Normalized 6 different concentration of Theophylline with NT & N.
 "
"


