Construction usu.html
From 2010.igem.org
(→New Contributions) |
|||
| Line 53: | Line 53: | ||
| - | Fig 2: 1H NMR spectra with PHA characteristic peaks amplified. The top spectrum reports PHA isolated gravimetrically from a culture containing HlyA targeted phasin. The bottom spectrum reports PHA in the negative control. Notice the differences in | + | Fig 2: 1H NMR spectra with PHA characteristic peaks amplified. The top spectrum reports PHA isolated gravimetrically from a culture containing HlyA targeted phasin. The bottom spectrum reports PHA in the negative control that is producing PHA but not secreting phasin. Notice the differences in peak intensities (y-axis). |
| - | + | ||
=References= | =References= | ||
Revision as of 18:42, 27 October 2010
Construction
Contents |
Cyanobacterial Toolkit Construction
Integration Plasmid Construction
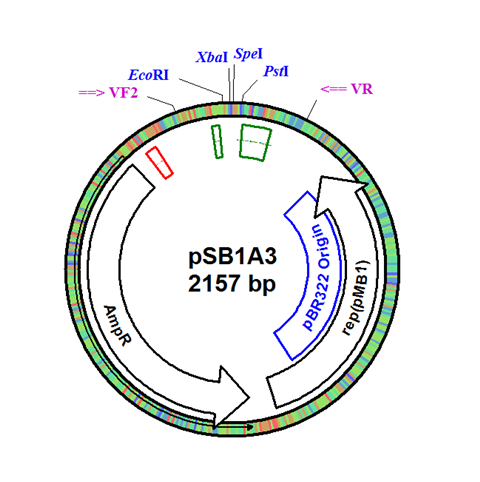
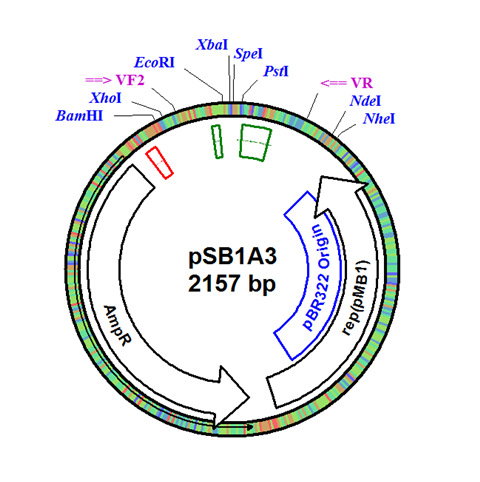
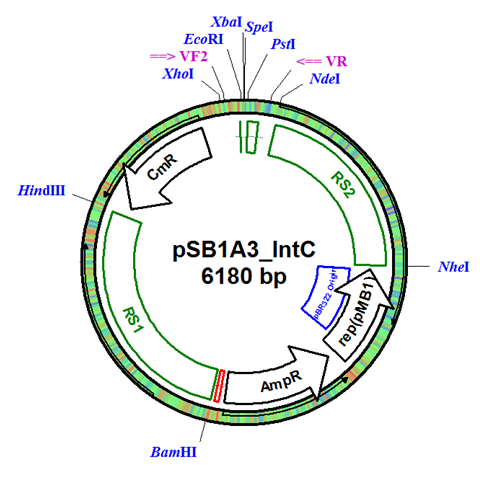
The integration plasmid was constructed starting with pSB1A3 (Figure 1A). Four additional restriction sites (BamHI, XhoI, NdeI, and NheI) were added outside of the BioBrick docking sequence to allow recombination regions and Synechocystis-specific antibiotic resistance genes to be cloned in (Figure 1B). The two recombination regions (RS1 and RS2) where then cloned in flanking the BioBrick site, and a resistance gene (either Kanamycin resistance or Chloramphenicol resistance) was cloned in next to the BioBrick site (Figure 1C). An additional HindIII restriction site was added between the resistance gene and the RS1 region. This plasmid design allows for selection of the integrated BioBrick using the inserted resistance gene. These recombination regions and resistance genes can be easily exchanged for any desired region or resistance using restriction digest and ligations.
We decided to expand the current BioBrick plasmid naming convention for integration plasmids by adding the "_Int[Integrated Resistance][Species Abbreviation (include only if recombination regions are added)]" to the plasmid name. This provides the user with information on what resistance the cells with integrated BioBricks will have, and what species-specific recombination sites (if any) are part of the plasmid.
Figure 1. (A) The pSB1A3 plasmid which served as the starting point of construction. (B) Four restriction sites added surrounding the BioBrick site in pSB1A3. (C) Finished pSB1A3_IntC plasmid with recombination regions RS1 and RS2 and chloramphenicol resistance gene.
Promoter Construction
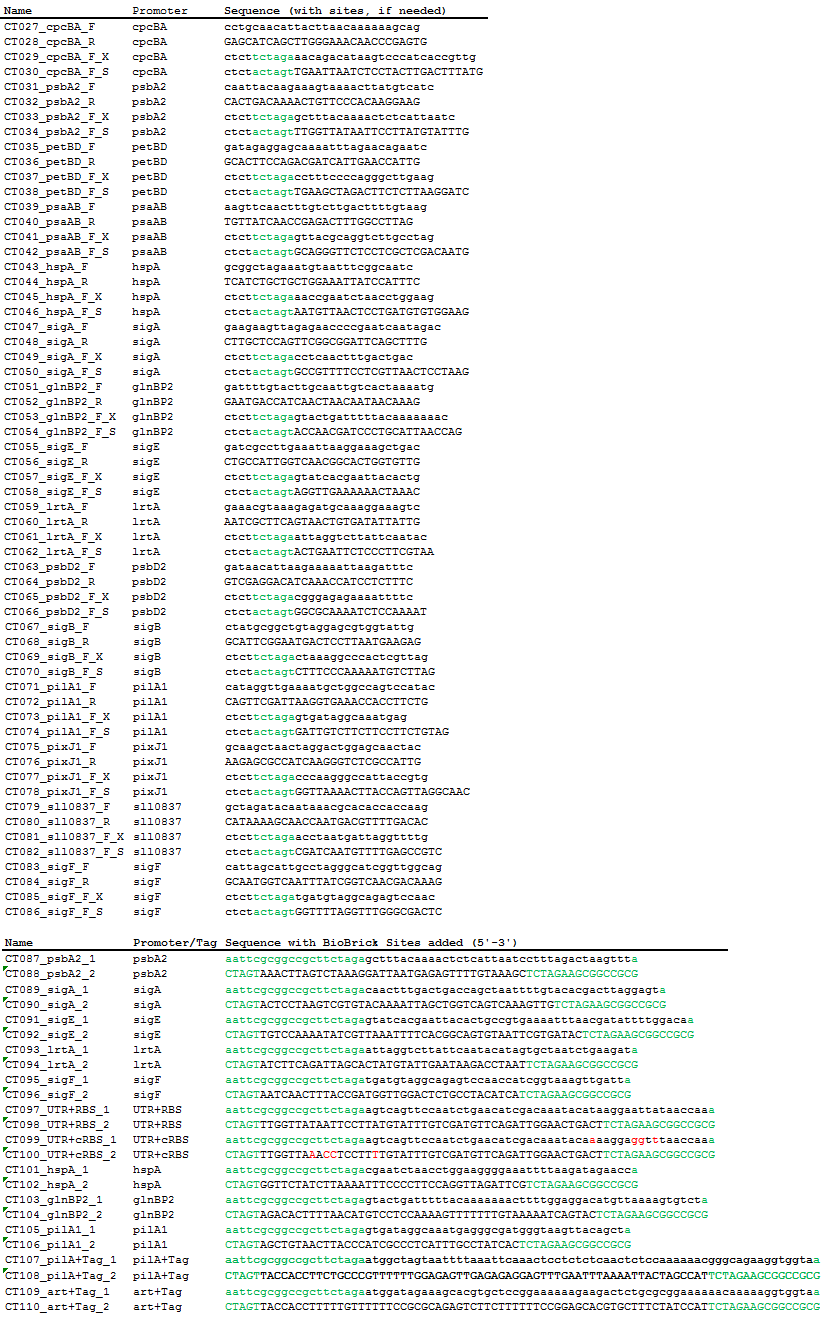
Using PCR, we amplified 15 native Synechocystis promoters and their native 5’ UTR and RBS regions from genomic DNA. Using oligonucleotide pairs, we created the 15 promoters alone (without their native 5’UTR and RBS), a standard native 5’UTR and RBS from Synechocystis, a consensus 5’UTR and RBS, and two secretion tags that function in Synechocystis, one native to the species and one artificially created.
Table 2. Primers used for PCR amplification from genomic DNA and oligonucleotide pairs. Four base pairs were added to the ends of the primers to increase digestion efficiency and equalize the Tm of the primer pairs. Green sequences are added BioBrick prefix and suffix sequences. Red bases are the bases mutated with site-directed mutagenesis.
E. coli Protein Secretion System Construction
In addition to our work developing the cyanobacterial toolkit, an effort was made to complete and further characterize portions of our 2009 project [1] during this iGEM season. USU’s 2009 iGEM team focused on simplifying cellular product recovery by developing a platform for protein secretion systems in the BioBricks format.
Overview
Recovery costs of cellular products can account for as much as 80% of production expenses (Hearn and Acosta, 2001). In an attempt to reduce recovery costs, we developed a library of Silver fusion compatible gene constructs coding for secretion signal peptides. Five signal peptides commonly utilized in E. coli were converted to BioBrick format. Testing was performed by fusing signal peptides to the cycle 3 mutant of green fluorescent protein and the protein phasin. GFP was targeted as a model protein because of its ease of detection. Phasin is a protein coexpressed in organisms that produce polyhydroxyalkanoates (PHAs), a class of bioplastics. Phasin has been shown to interact and bind to PHA granules and to modify granule size (York, 2001; Maehara, 1999). Phasin targeted for secretion could produce a phasin-PHA complex, effectively transporting PHAs into the extracellular media. Transport of PHA into the media could reduce costs of bioplastic production and make this alternative plastic a more viable competitor to traditional petrochemically derived plastics. At the time of last year’s jamboree, SDS-PAGE indicated that GFP and Phasin were both successfully released into the extracellular media when fused to the GeneIII signal peptide.
New Contributions
Two additional secretion composite parts have been completed and submitted to the parts registry. These parts allowed us to test the functionality of the HlyA signal peptide. Most significantly, the proof of concept of the phasin/PHA complex secretion was verified using the HlyA targeted phasin.
Fig 1: Parts BBa_K390501 and BBa_K390502 submitted to the parts registry.
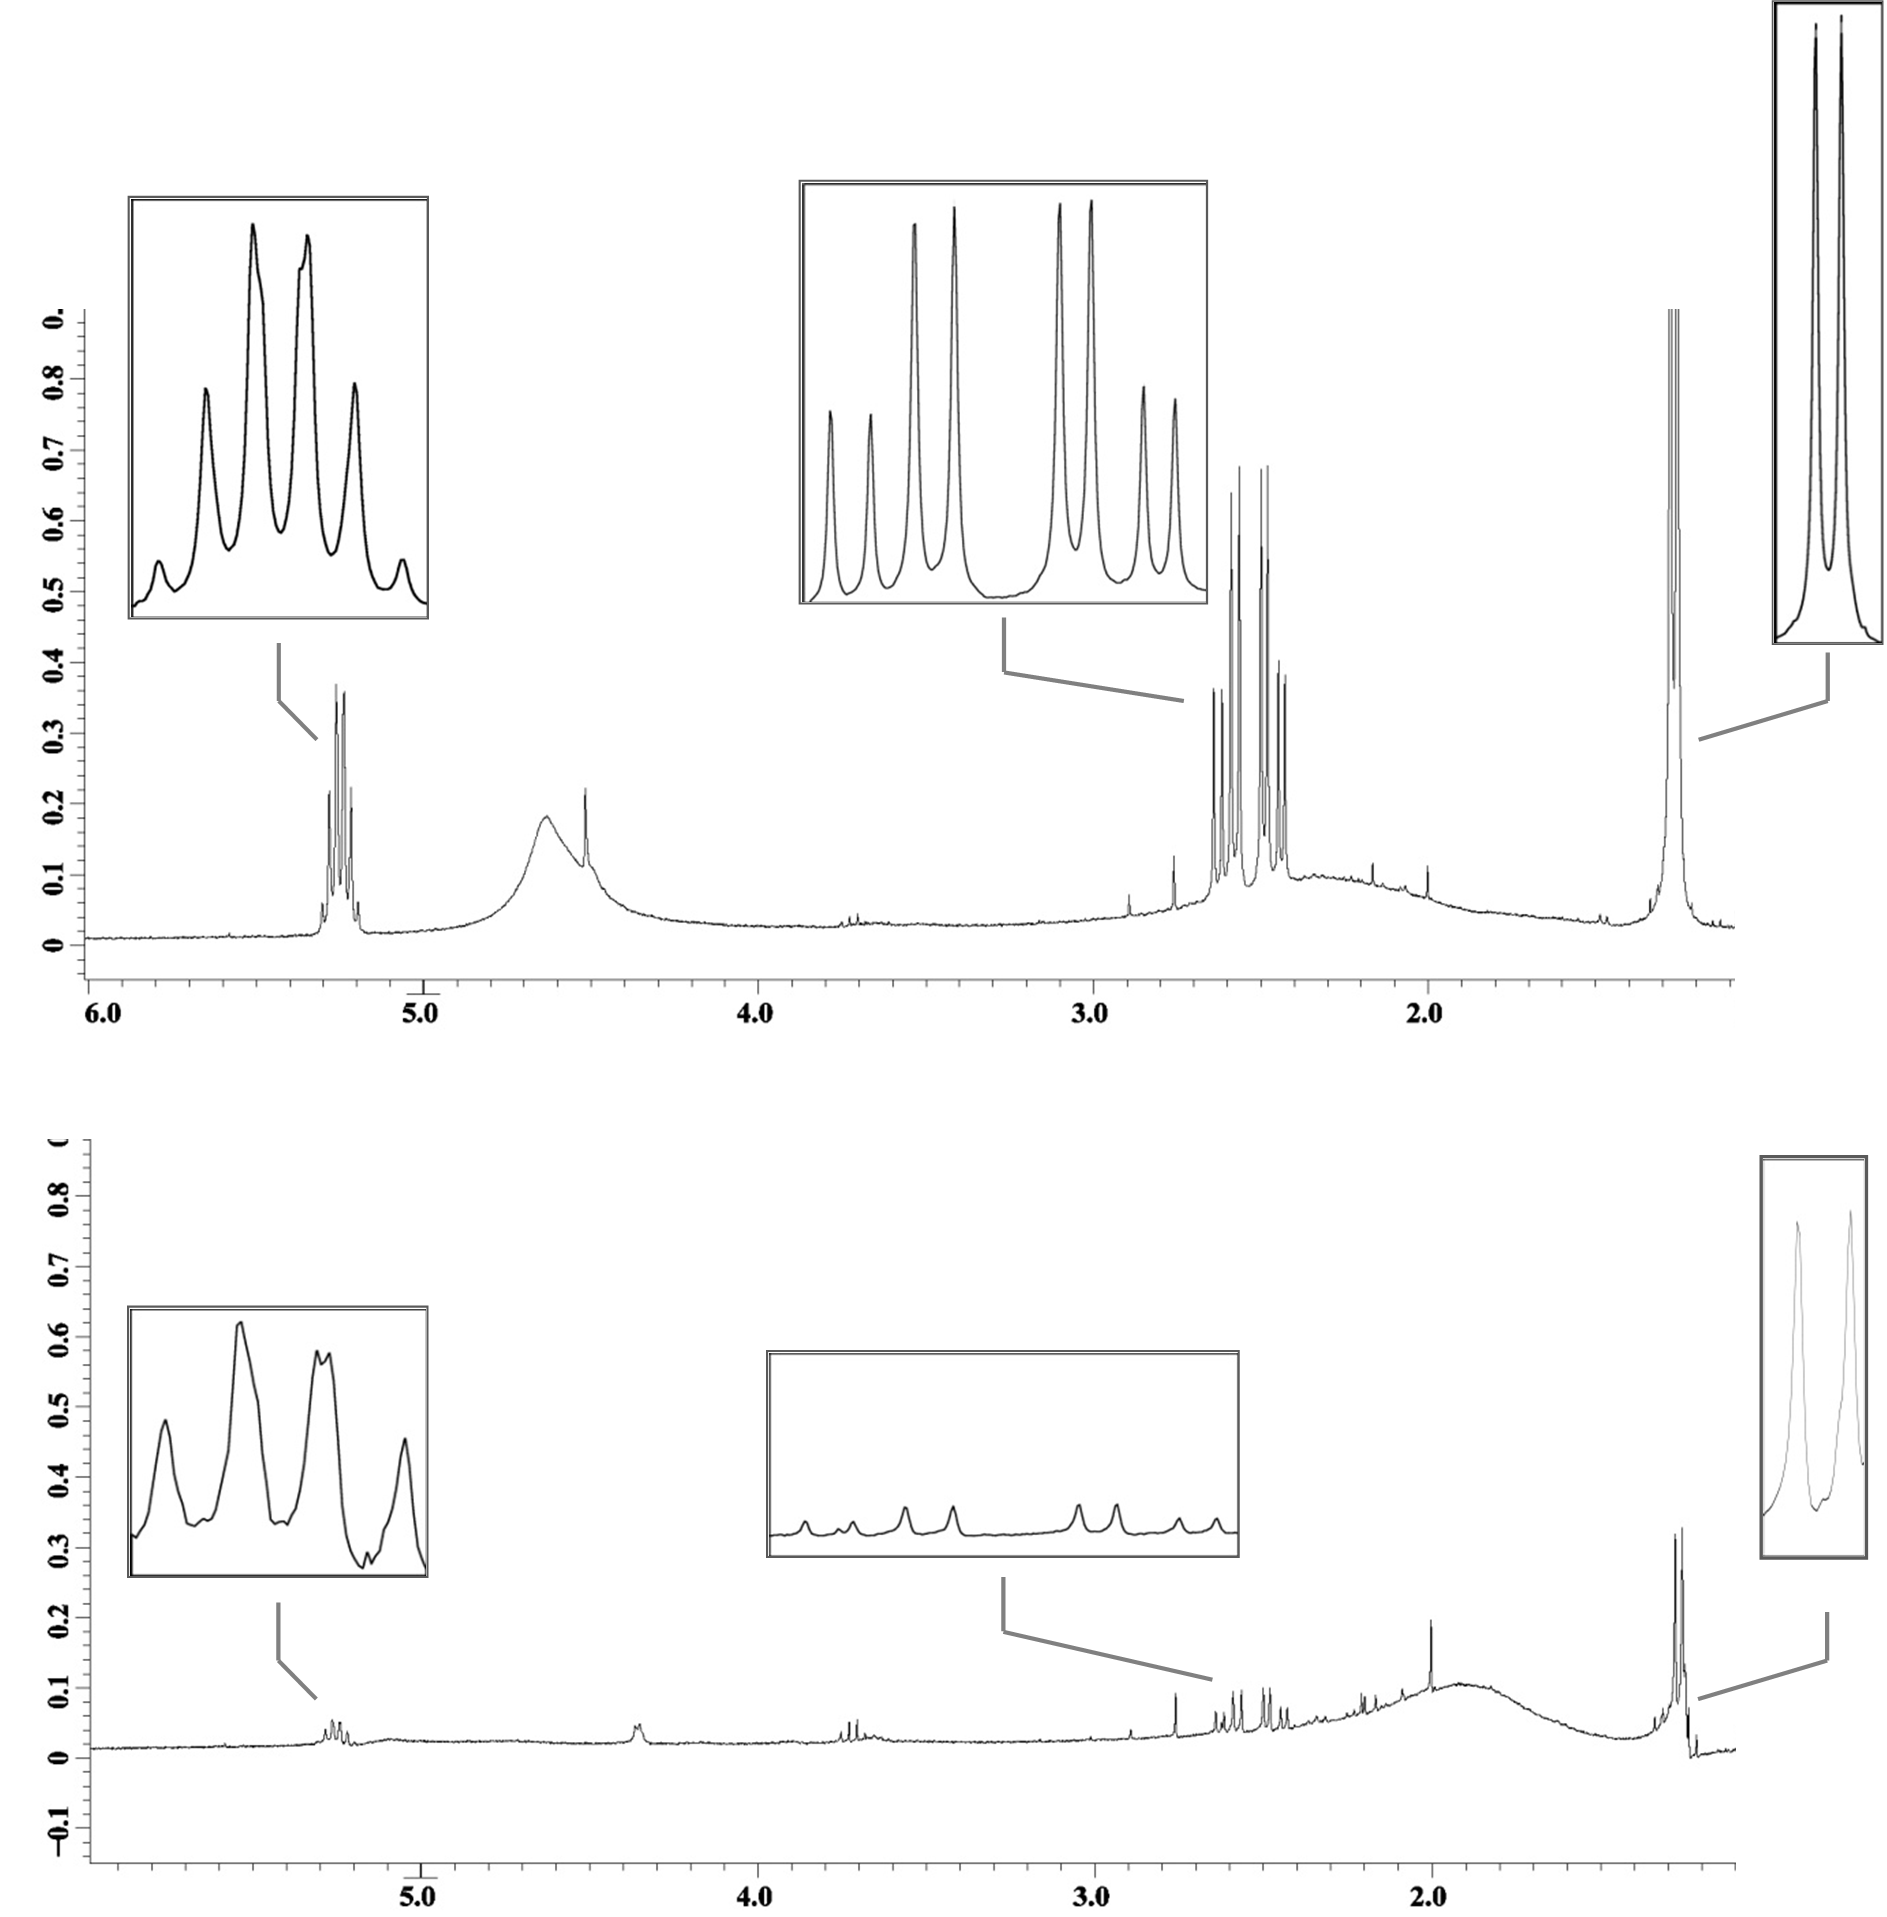
Cells containing the genes necessary for PHA production, HlyBD membrane proteins, and the HlyA targeted phasin (BBa_K390501) were grown in M9 minimal media. Cells containing the genes for PHA production and the HlyBD membrane proteins were grown as a negative control. After 30 hours of growth, a nucleating agent was added to both cultures and centrifuged. The resulting pellet was purified and analyzed using quantitative 1H NMR. Differences in intensity of the 1H NMR spectra indicate that PHA is released into the extracellular media when HlyA targeted phasin is expressed. We have reason to believe that this platform can be optimized to significantly reduce costs associated with commercial PHA production. This additional work further validates the parts created by USU’s 2009 team and the potential for their implementation in other cellular product recovery.
Fig 2: 1H NMR spectra with PHA characteristic peaks amplified. The top spectrum reports PHA isolated gravimetrically from a culture containing HlyA targeted phasin. The bottom spectrum reports PHA in the negative control that is producing PHA but not secreting phasin. Notice the differences in peak intensities (y-axis).
References
Hearn MT, Acosta D (2001) Applications of novel affinity cassette methods: Use of peptide fusion handles for the purification of recombinant proteins. J Mol Recognit 14:323-369
Maehara A, Ueda S, Nakano H, Yamane T (1999) Analyses of a polyhydroxyalkanoic acid granule-associated 16-kilodalton protein and its putative regulator in the pha locus of Paracoccus denitrificans. J Bacteriol 191:2914-2921
York GM, Junker BH, Stubbe J, Sinskey AJ (2001) Accumulation of the PhaP Phasin of Ralstonia eutropha is dependent on production of polyhydroxybutyrate in cells. J Bacteriol 183:4217-4226
 "
"

