Team:TU Delft/Modeling/HC regulation/Sensitivity
From 2010.igem.org
Lbergwerff (Talk | contribs) |
Lbergwerff (Talk | contribs) (→Sensitivity analysis) |
||
| Line 1: | Line 1: | ||
==Sensitivity analysis== | ==Sensitivity analysis== | ||
| + | |||
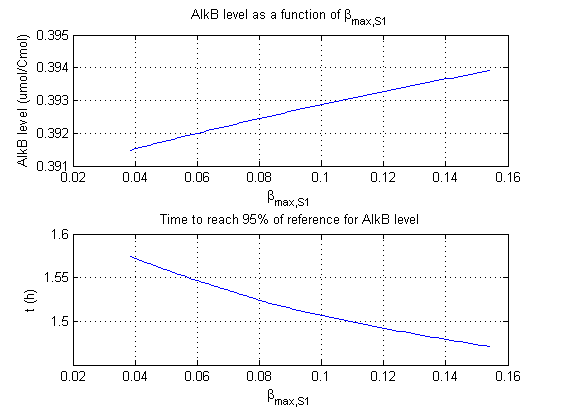
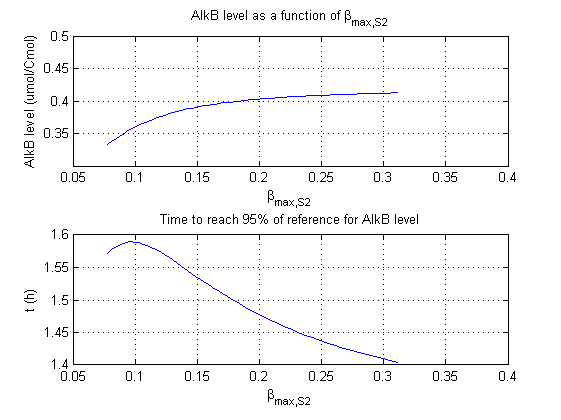
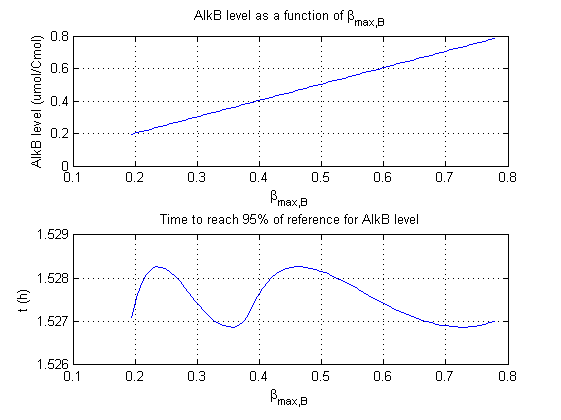
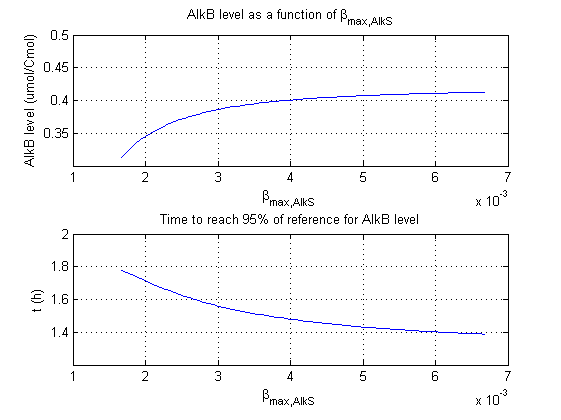
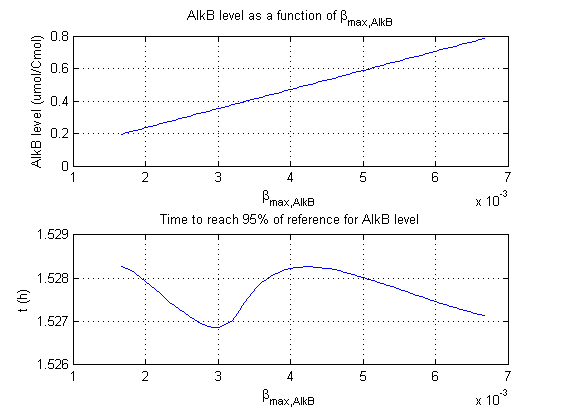
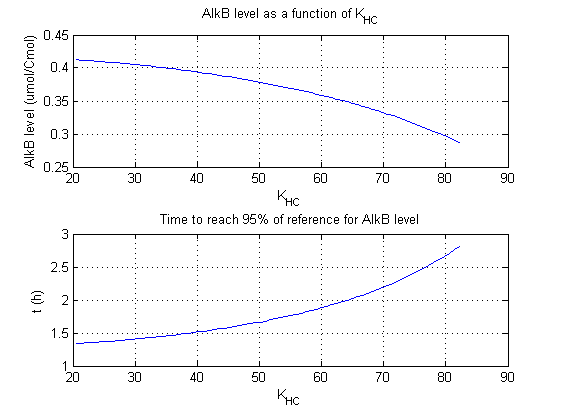
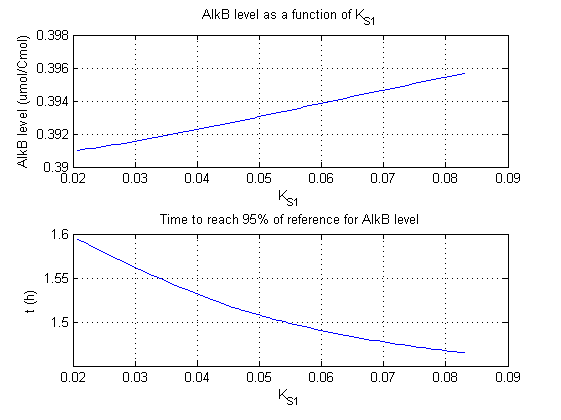
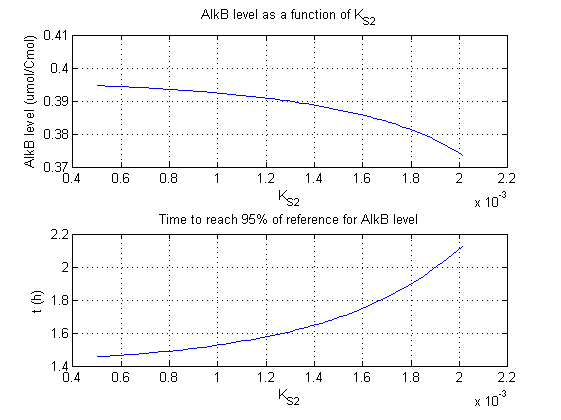
| + | For all beta parameters (lumped variables for transcriptions speed, translations speed, promoter strength and rbs strength) and all K parameters (equilibrium constant for binding of AlkS with alkanes and coefficients for the activity of promoters) a sensitivity analysis has been performed. This was done by varying the parameters from 50% of their original values to 200% of their original values. | ||
| + | |||
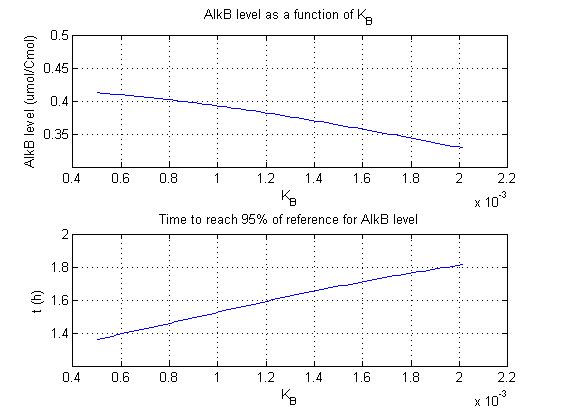
| + | For this range of parameter values it is checked how much the steady state concentration of AlkB is and how long it takes for 95% of the steady state concentration of AlkB to be reached from steady state values for no alkanes to steady state values for 1 µM of alkanes. | ||
| + | |||
| + | In the figures below are the results for this sensitivity analysis. | ||
| + | |||
[[Image:Team_TUDelft_beta_S1.png|thumb|600 px|centre|'''Figure 1''' – Sensitivity analysis of parameter β<sup>max</sup><sub>S1</sub>]] | [[Image:Team_TUDelft_beta_S1.png|thumb|600 px|centre|'''Figure 1''' – Sensitivity analysis of parameter β<sup>max</sup><sub>S1</sub>]] | ||
Revision as of 11:28, 27 October 2010
Sensitivity analysis
For all beta parameters (lumped variables for transcriptions speed, translations speed, promoter strength and rbs strength) and all K parameters (equilibrium constant for binding of AlkS with alkanes and coefficients for the activity of promoters) a sensitivity analysis has been performed. This was done by varying the parameters from 50% of their original values to 200% of their original values.
For this range of parameter values it is checked how much the steady state concentration of AlkB is and how long it takes for 95% of the steady state concentration of AlkB to be reached from steady state values for no alkanes to steady state values for 1 µM of alkanes.
In the figures below are the results for this sensitivity analysis.
Go back to the model explanation here
Go back to the main modeling page here
 "
"
